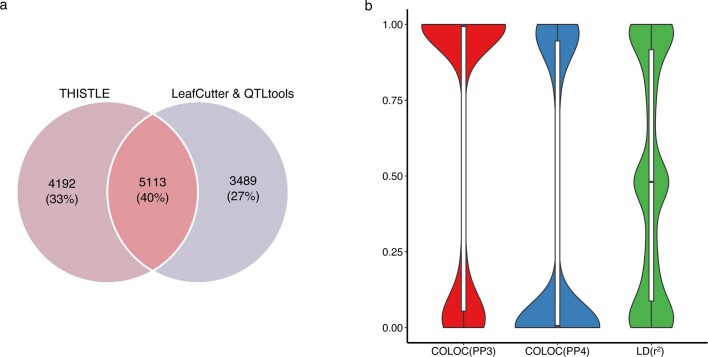
Extended Data Fig. 7. Comparison between the sQTLs results from THISTLE and LeafCutter & QTLtools.
a) Comparison between the sGenes identified by THISTLE and LeafCutter & QTLtools. b) COLOC PP3 and PP4 values between the THISTLE and LeafCutter & QTLtools sQTL signals, and LD r2 between the lead THISTLE and LeafCutter & QTLtools cis-sQTL SNPs for 5,113 overlapping sGenes. In panel b, the bold line inside each box indicates the median value, notches indicate the 95% confidence interval (CI), the central box indicates the interquartile range (IQR), and whiskers indicate data up to 1.5 times the IQR.

