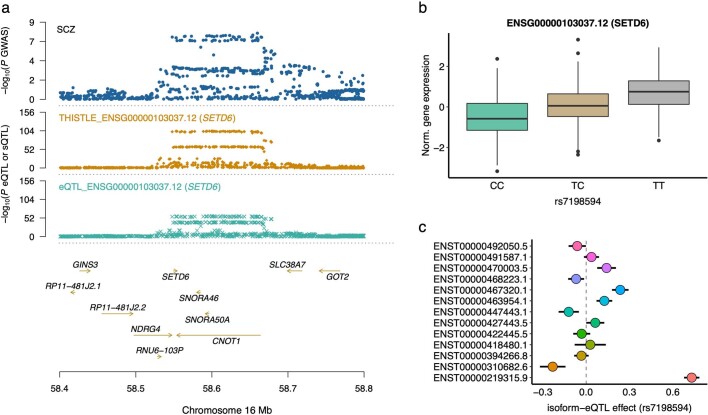
Extended Data Fig. 9. Association of SETD6 with schizophrenia identified using either sQTL or eQTL data.
a) The top track shows −log10(p-values) of SNPs from the schizophrenia GWAS. The second and third tracks show −log10(p-values) from the THISTLE sQTL and eQTL analyses, respectively. The THISTLE sQTL and eQTL p-values were computed using a one-sided sum of chi-squared test and chi-squared test, respectively. b) Association of rs7198594 (the lead eQTL SNP) with the overall mRNA abundance of SETD6 in the ROSMAP data (n = 832). Each boxplot shows the distribution of mRNA abundances in a genotype class, that is, CC (n = 288), CT (n = 392), or TT (n = 152). The line inside each box indicates the median value, notches indicate the 95% CI, the central box indicates the IQR, whiskers indicate data up to 1.5 times the IQR, and outliers are shown as separate dots. c) Isoform-eQTL effects for SETD6 in the whole dataset (n = 2,865), with ENST00000310682.6 and ENST00000219315.9 at the two extremes with opposite isoform-eQTL effects. Each dot represents an estimate of isoform-eQTL effect with an error bar indicating the 95% CI of the estimate.

