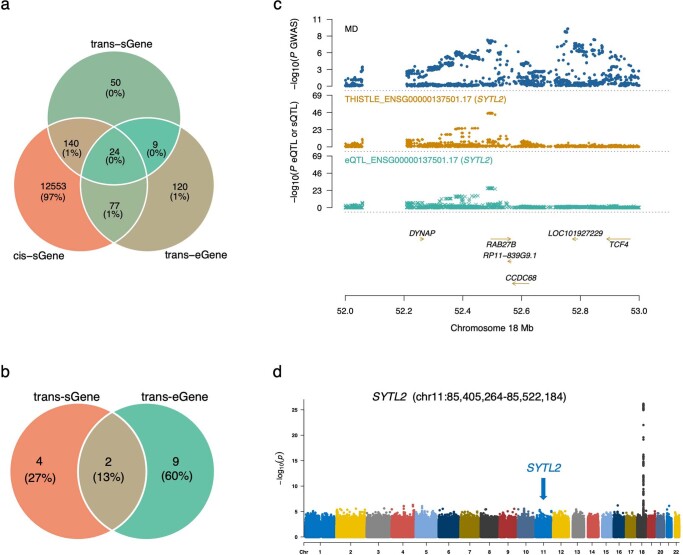
Extended Data Fig. 10. Trans-sQTL analysis.
a) Overlaps between trans-sGenes, cis-sGenes, and trans-eGenes. b) Overlap of the trait-associated trans-sGenes and trans-eGenes identified by SMR & COLOC PP4. c) Association of SYTL2 with major depression (MD) through both the trans-sQTLs and trans-eQTLs. The top track shows −log10(p-values) of SNPs from the MD GWAS. The second and third tracks show −log10(p-values) from the THISTLE trans-sQTL and trans-eQTL analyses, respectively, for SYTL2. d) Manhattan plot of p-values from genome-wide THISTLE sQTL analysis for SYTL2. The blue arrow indicates the genomic position where SYTL2 is located. The GWAS and eQTL p-values in panel c were computed using a one-sided chi-squared test, and the THISTLE sQTL p-values in panels c and d were computed using a one-sided sum of chi-squared test.

