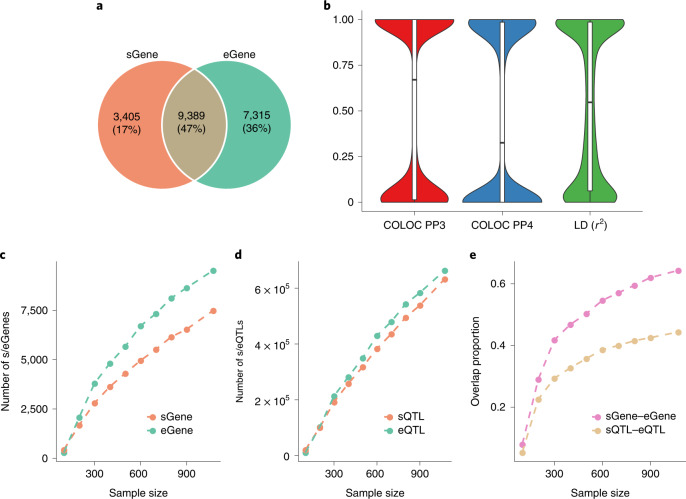
Fig. 2. Relationship between sQTLs and eQTLs.
a, Overlap between sGenes and eGenes. b, COLOC PP3 and PP4 values between the cis-sQTL and cis-eQTL signals and LD r2 between the lead cis-sQTL and cis-eQTL SNPs for the 9,389 overlapping genes. The line inside each box indicates the median value, the notches indicate the 95% confidence interval (CI), the central box indicates the interquartile range (IQR) and the whiskers indicate data up to 1.5 times the IQR. c, The number of sGenes (or eGenes) discovered as a function of sample size. d, The number of sQTLs (or eQTLs) discovered as a function of sample size. e, The overlap between sGenes and eGenes (or between sQTLs and eQTLs) as a function of sample size, where sQTL–eQTL overlap is defined as the proportion of sGenes for which the lead sQTL SNP is a significant eQTL SNP for the same gene.

