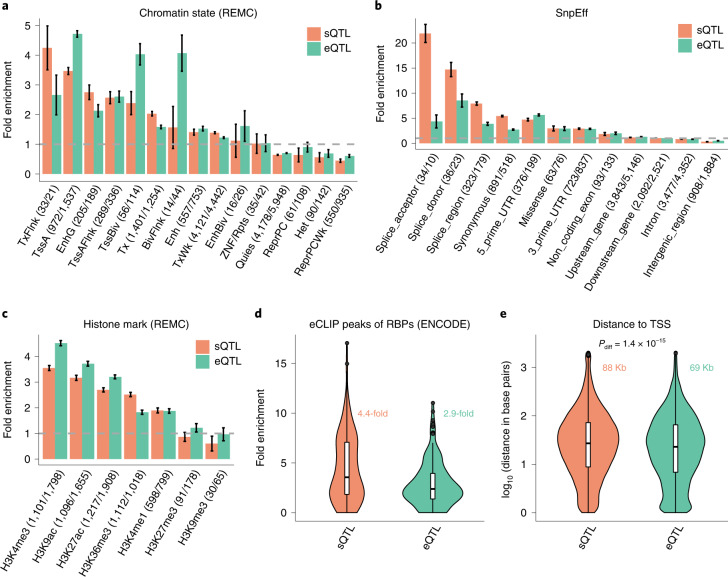
Fig. 3. Enrichment of the lead cis-sQTL or cis-eQTL SNPs in functional annotation categories.
a–d, The annotation categories were defined by the chromatin state annotation data from REMC (a), predicted variant functions by SnpEff (b), histone marks from REMC (c) and eCLIP peaks of 113 RBP binding sites from ENCODE (d). a–c, The fold enrichment was computed by dividing the percentage of lead cis-sQTL (or cis-eQTL) SNPs in a category by the mean percentage observed in 1,000 sets of control SNPs sampled repeatedly at random (Methods). Each column represents an estimate of fold enrichment with an error bar indicating the 95% CI of the estimate. The gray dashed line represents no enrichment. The numbers in parentheses are the number of sQTL/eQTL SNPs in each functional category. d, The text in color represents the median across 113 RBP binding sites. e, Distance of the lead cis-sQTL (or cis-eQTL) SNP to the TSS of the gene. The texts in color represent the median across 12,794 sGenes and 16,704 eGenes, respectively; Pdiff was computed from a two-sided t-test for a mean difference between the two groups. d,e, The violin plots show the distributions of fold enrichment estimates of sQTL and eQTL SNPs across the 113 RBP biding sites (d) or distances to the TSS across 12,794 sGenes and 16,704 eGenes (e), respectively. The line inside each box indicates the median value, the notches indicate the 95% CI, the central box indicates the IQR, the whiskers indicate data up to 1.5 times the IQR and the outliers are shown as separate dots.

