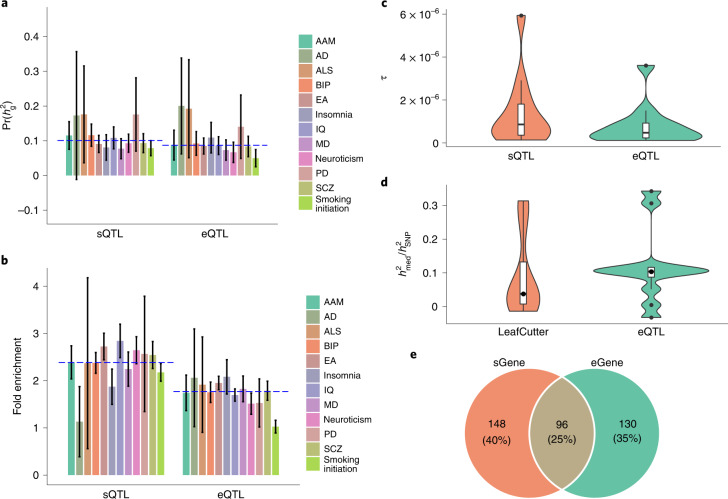
Fig. 4. Enrichment of the lead cis-sQTL or cis-eQTL SNPs for heritability of the 12 brain-related traits.
a, is a ratio of heritability attributable to the SNPs in query to the overall SNP-based heritability (). b, Heritability enrichment is defined as a ratio of the proportion of heritability explained by the SNPs in query to the mean proportion observed in 1,000 sets of control SNPs sampled repeatedly at random (Methods). a,b, The blue dashed line represents the median value across traits; each column represents a point estimate with an error bar indicating the 95% CI of the estimate. c, The stratified LD score regression parameter τ was used to assess the contribution of the lead cis-sQTL SNPs to heritability when fitted jointly with the lead cis-eQTL SNPs. d, Proportion of heritability mediated by the cis-sQTL (or cis-eQTL) SNPs (), estimated by the mediated expression score regression. Only the sQTLs discovered by LeafCutter and QTLtools were included in the mediated expression score regression analysis. c,d, The violin plots show the distributions of the estimates of τ and , respectively, across the 12 traits. The line inside each box indicates the median value, the notches indicate the 95% CI, the central box indicates the IQR, the whiskers indicate data up to 1.5 times the IQR and the outliers are shown as separate dots. e, Overlap between the trait-associated sGenes and eGenes identified by SMR and COLOC PP4.

