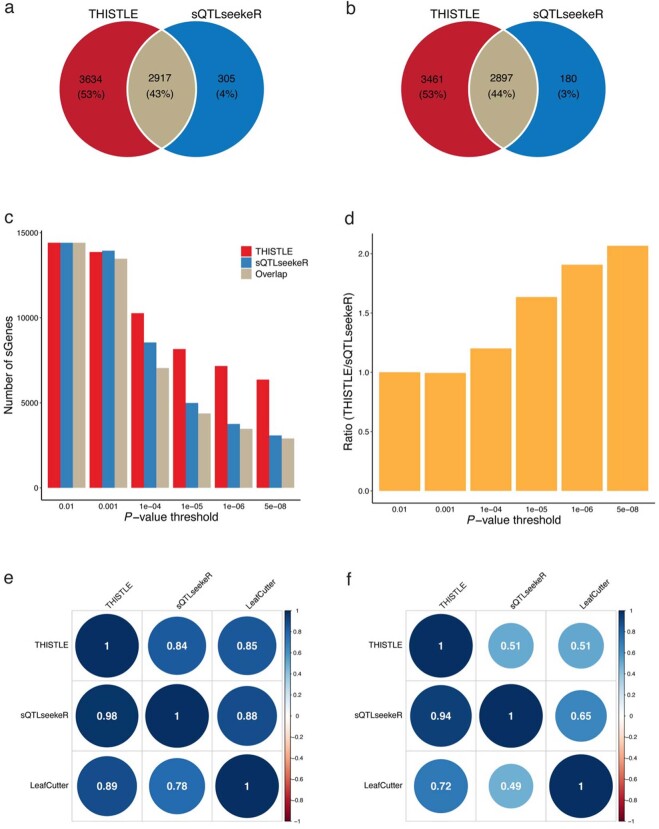
Extended Data Fig. 3. Comparison between sQTL results from the sQTLseekeR, THISTLE, and LeafCutter & QTLtools analyses of real data.
The analyses were performed with the ROSMAP data (n = 832). Panel a shows the numbers of overlapping sGenes between THISTLE and sQTLseekeR. Panel b shows the numbers of overlapping sGenes considering only the SNP-gene pairs tested in common between THISTLE and sQTLseekeR. Panel c shows the number of sGenes discovered at different p-value thresholds for THISTLE and sQTLseekeR. Panel d shows the ratio of the number of sGenes identified by THISTLE to that by sQTLseekeR at different p-value thresholds. Panels e and f show the replication rates of the lead cis-sQTL SNPs at PsQTL < 0.05 and PsQTL < 0.05/m (where m is the number of SNPs taken forward for replication for each method), respectively. Each row represents an analysis from which the lead cis-sQTL SNPs (one SNP per gene) were identified (), and each column represents an analysis in which the SNPs were replicated. The THISTLE, sQTLseekeR, and LeafCutter & QTLtool p-values were computed using a one-sided sum of chi-squared test, pseudo-F test, and chi-squared test, respectively.

