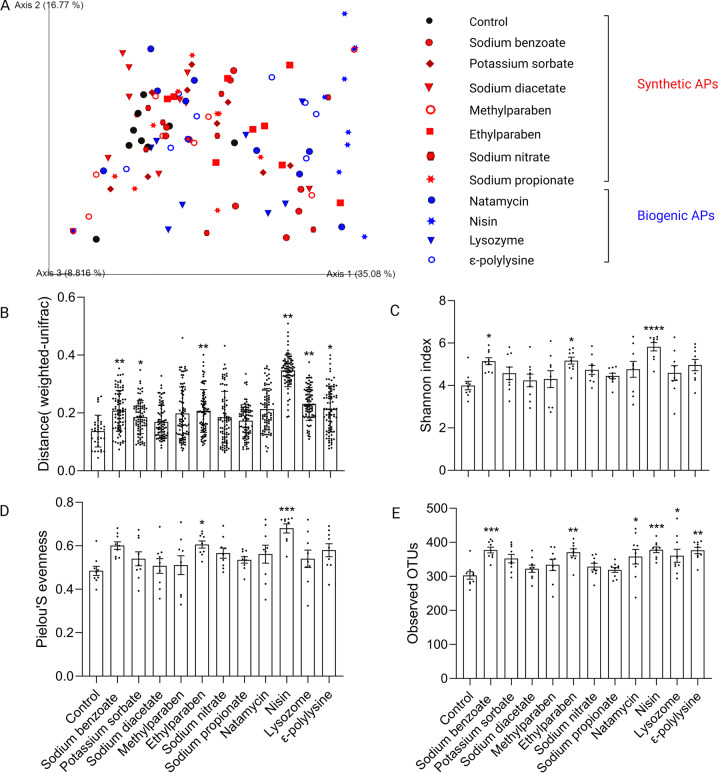
Fig. 2. Impact of APs on gut microbiota diversity.
A PCoA of the Weighted UniFrac distance matrix of fecal microbiota. B Weighted UniFrac distances between APs-treated and control microbiota was plotted and compared to the distances within control samples. Significance was determined by PERMANOVA. FDR *P < 0.05, **P < 0.01. C–E Alpha diversity analysis of gut microbiota between control and APs-treated groups measured with Shannon index (C), Pielou’s evenness index (D), and the number of observed OTUs (E). Significance was determined by ANOVA with Dunnett’s multiple comparisons test. The values are expressed as the means ± S.E.M., n = 9 per group. *P < 0.05, **P < 0.01, ***P < 0.001, ****P < 0.0001.

