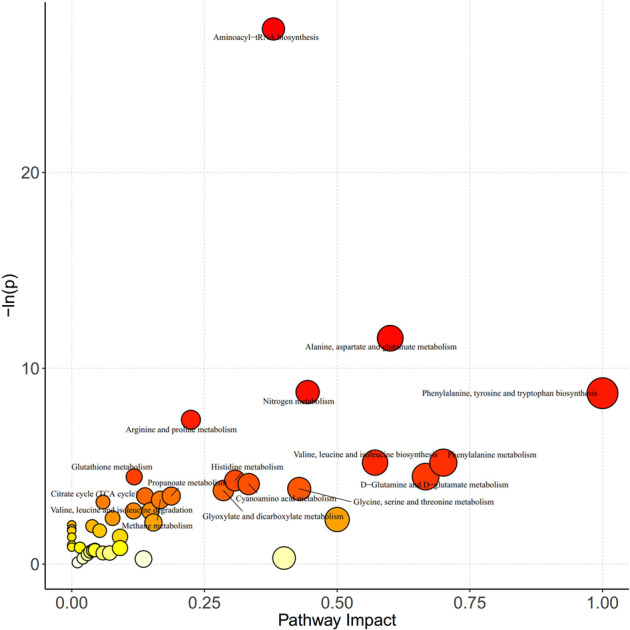
Fig. 5. Kyoto Encyclopedia of Genes and Genomes pathway analysis of differential metabolites.

X-axis represents the pathway impact obtained by the out-degree centrality algorithm. The size of the point is related to the pathway impact. Y-axis represents the negative logarithm of the p-value (−ln(p)) obtained by the pathway enrichment analysis. The yellow-red color change of the point is positively related to the −ln(p). The names of pathways are labeled in the graph with −ln(p) > 3.
