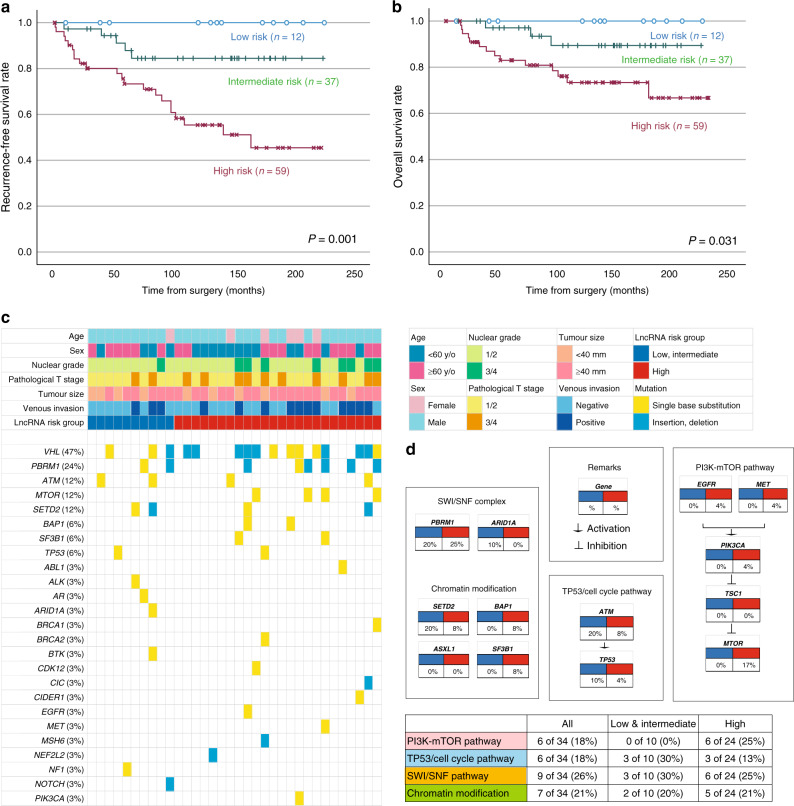
Fig. 4. Relationship between the lncRNA risk classification, outcome of prognosis and genetic alterations in ccRCC patients.
a, b Kaplan–Meier curves of disease-free (a) and overall survival (b) according to the lncRNA risk groups comprising three lncRNA (TUG1, CDKN2B-AS1 and HOTAIR) expression, compared using the Cox regression analysis. c Alteration landscape of 34 primary ccRCC tumour samples. Upper heatmap: age, sex, nuclear grade, pathological tumour stage, tumour size, venous invasion and the lncRNA risk groups. d Genomic alterations in tumorigenic signalling pathways related to ccRCC development on the lncRNA risk groups. The table shows the percentage of samples with alterations in each of the selected signalling pathways.

