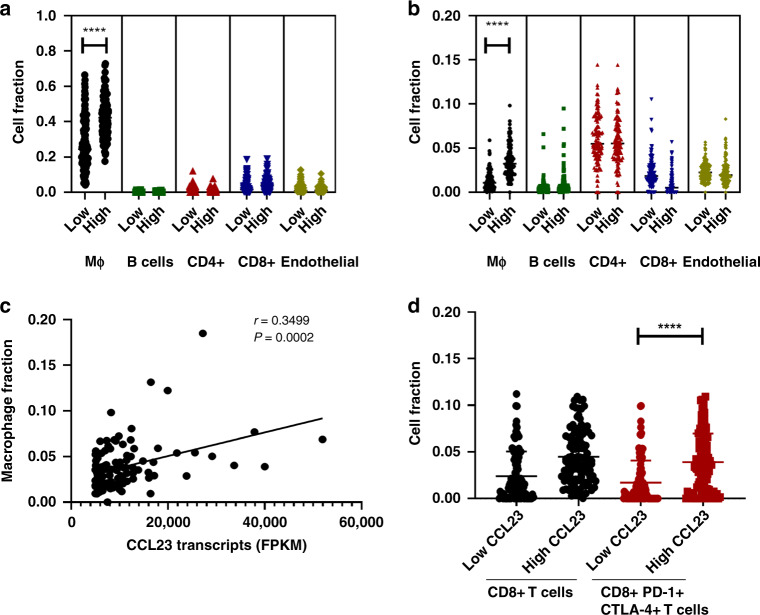
Fig. 2. Higher CCL23 expression correlates with the increase in exhausted CD8 + T cells and macrophage infiltration in TCGA.
a Estimated immune cell fractions in HGSC stratified by CCL23 levels (CIBERSORT). b Estimated immune cell fractions in HGSC stratified by CCL23 levels (EPIC). c Correlation of macrophage content with CCL23 expression in HGSC with high CCL23. d Increased CD8 + PD-1+ CTLA-4 + T cells in HGSC with high CCL23. All statistical analyses were carried out by an unpaired t test (*P < 0.05; ****P < 0.0001).

