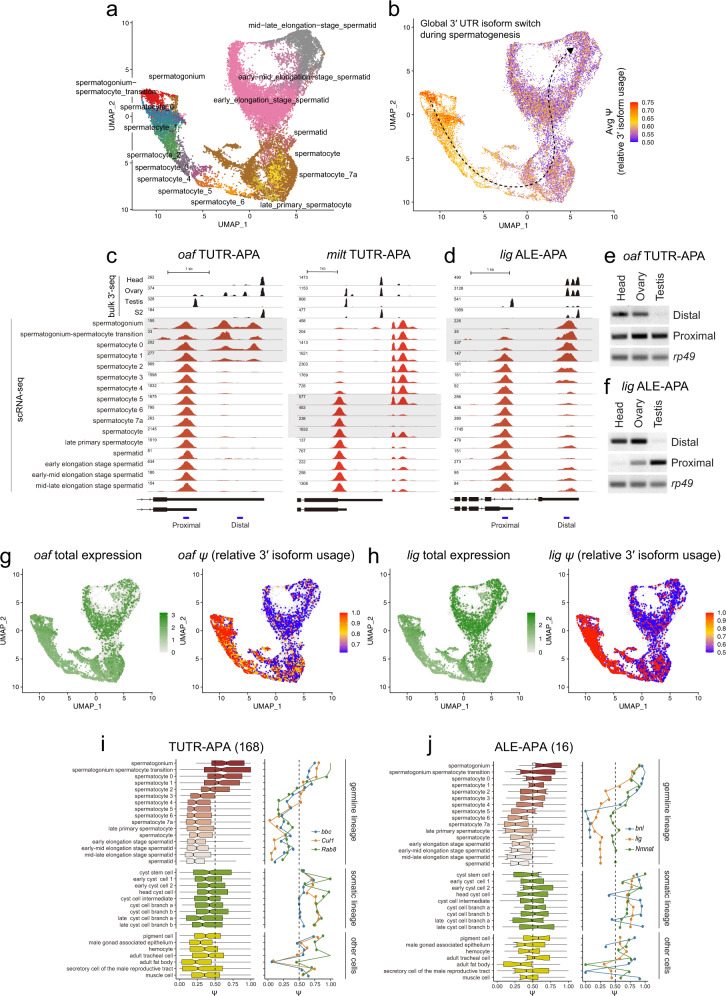
Fig. 4. Deconvolution of 3’ isoform programs in the testis germline lineage.
a UMAP of testis germline cell types in a trajectory from germline stem cells (spermatogonium), meiotic spermatocytes, to post-meiotic spermatids; several intermediary stages are also designated by the FCA. b Average 3’ isoform usage of dynamic 3’ isoform switching genes during spermatogenesis in individual cells. c, d Previously, we observed that bulk testis transcripts exhibit globally shorter 3’ UTRs than most other tissues and cell types (compare with ovary, head and S2 cells), suggesting that a dominant cell type(s) in testis preferentially utilize proximal pA sites. sNuc-seq data pinpoint transitions of 3’ isoforms in the testis germline. c Tandem 3’ UTR (TUTR) processing at oaf, which utilizes a longer 3’ UTR in spermatogonium and early spermatocyte stages but transitions to a shorter 3’ UTR in spermatocyte stages 1-2, which is maintained into spermatids. d Alternative last exon (ALE) processing at lig, which utilizes a distal ALE isoform in stem cells but transitions to a proximal ALE isoform in early spermatocytes. e, f Semi-quantitative RT-PCR validation for testis-specific expression of different 3’ UTR isoforms of oaf (e) and lig (f). Data is representative of 2 independent experiments; amplicons are 100–200 bp. Source data are provided as a Source Data file. g, h APA analysis in individual cells. oaf and lig maintain similar expression across spermatogenesis. However, expression of the oaf extended 3’ UTR (g) and the lig distal ALE isoform (h) are exclusive to early spermatogenesis. i Global TUTR shortening in testis occurs during early spermatocyte stages (left, n = 168). Examples of TUTR shortening profiles for three representative genes (right) (j) Global proximal ALE isoform switching in testis similarly occurs in early spermatocytes (left, n = 16). Examples of proximal ALE switching profiles for three representative genes (right). The boxes are shown on the left side of the panels represent the interquartile ranges, the center lines represent medians, and the whiskers denote the ranges of minima and maxima.

