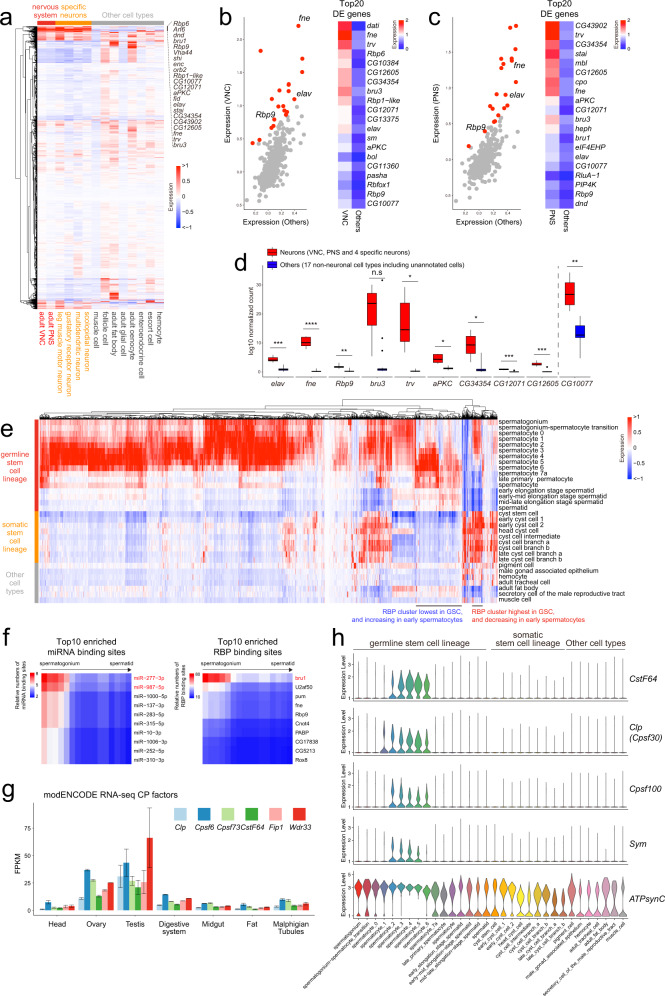
Fig. 6. Specific RBPs and global alteration of CPA factors are candidate APA regulators.
a Hierarchical clustering of RBPs across cell types in the FCA body dataset shows a subset of factors that are commonly elevated across multiple individual neuron types (red and orange cell classes; other cell types designated in gray). These include ELAV/Hu factors Fne and Elav, which direct global neural ALE and APA programs, potentially with their other paralog Rbp9. b, c Enrichment of RBPs in ventral nerve cord (VNC, part of the central nervous system) and peripheral nervous system (PNS), compared to all other non-neuronal cell types in the FCA body dataset. d Expression levels of neural-enriched RBP candidates compared to all other non-neuronal cell types in the FCA body dataset. The boxes represent the interquartile ranges, the center lines represent medians, and the whiskers denote the ranges of minima and maxima. Significant differences between the two groups were assessed by a two-sided Wilcoxon-Wilcox test, with P values adjusted from multiple hypothesis testing with a Bonferroni correction. (NS, not significant, *P < 0.05, **P < 0.01, ***P < 0.001, ****P < 0.0001) (e) Hierarchical clustering of RBPs across cell types in the FCA testis dataset shows large scale changes in RBP expression in the germline (red cell classes). f Top 10 enriched miRNAs (left) and RBPs (right) that target 3’ UTR regions of genes that are lost in shorter isoforms during spermatogenesis. Mostly enriched miRNAs and RBPs are highlighted as red. g Multiple cleavage and polyadenylation (CPA) factors are upregulated in gonads compared to all other somatic tissues; data plotted from modENCODE bulk RNA-seq data from dissected tissues. Data are presented as mean values +/− SD pooled from three independent experiments. h Data from FCA testis dataset highlights the specific upregulation of multiple CPA factors in early spermatocytes, when global 3’ UTR shortening and proximal ALE switching trends are detected. ATPsynC is shown as a ubiquitous control gene that is well-expressed in all germline and somatic cell types of the testis. Data for all CPA factors and additional control genes are shown in Supplementary Fig. 8.

