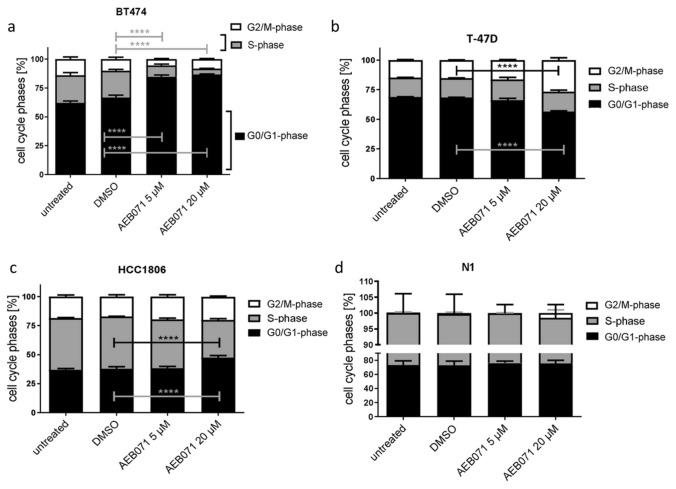
Fig. 1.
Distribution of cell cycle phases found in untreated or DMSO treated (both controls) and AEB071 (5 and 20 µM) treated BT474, T-47D, HCC1806, and N1 cells grown as ML. BT474 cells turned out as most sensitive to AEB071 treatment, which is reflected by a profound and highly significant decrease of the S-Phase fraction and a pronounced G1-phase compared to untreated cells. T-47D cells show an elevated G1-and G2-phase when exposed to 20 µM AEB071. Likewise, HCC1806 cells show only a response when exposed to 20 µM of the PKC inhibitor, reflected by as slight increase of the G1 cell fraction. N1 cells did not show any response to the treatment. Statistical analyses were done with the Dunnett's multiple comparisons test (DMSO as control; * = p ≤ 0.05; ** = p ≤ 0.01, ***p = ≤ 0.001). n = 3, data are shown as mean ± standard error of the mean (SEM)

