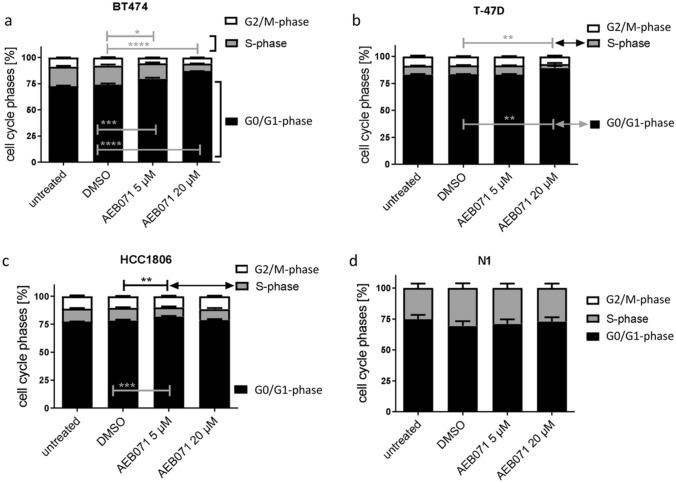
Fig. 2.
Distribution of cell cycle phases found in untreated or DMSO treated (both controls) and AEB071 (5 and 20 µM) treated BT474, T-47D, HCC1806, and N1 cells grown 3D spheroids. Overall, the proliferation capacity of the BC cells was lower in 3D MCTS culture compared to 2D ML culture. Nevertheless, BT474 cells remained the most sensitive cells when exposed to AEB071. Compared to this finding, the AEB071 treatment of T-47D and HCC1806 cells resulted in only little inhibitory effects, although with smaller statistical significance. Again, N1 cells were insensitive. Statistical analyses were done with the Dunnett’s multiple comparisons test (DMSO as control; * = p ≤ 0.05; ** = p ≤ 0.01, *** = p ≤ 0.001). n = 3, data are shown as mean ± standard error of the mean (SEM)

