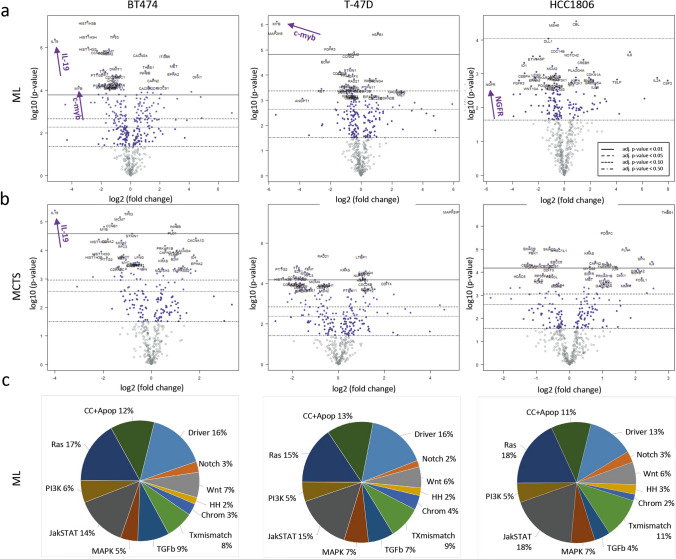
Fig. 4.
A and B Volcano plots showing differential gene expression of 730 mRNA analytes of the nCounter PanCancer nanoString assay as a function of ML and MCTS treatments with AEB071 (n = 3). DMSO treated cells served as reference. Data are displayed as log2 fold changes (x-axes) vs. significances of changes (y-axes) expressed as log10 p-values. Different significance levels (p ≤ 0.01, 0.05, 0.10, 0.50) are indicated by solid, dashed, and dotted lines (see insert in the right plot of panel A) as well as purple colored dots. Genes most heavily downregulated with pronounced significance are marked by an arrow (i.e., BT474 ML: IL19, c-myb; BT474 MCTS: IL19; T-47D: c-myb, HCC1806: NGFR). C Distribution of differentially expressed genes in BT474, T-47D, and HCC1806 ML cells caused by AEB071 treatment. Gene expressions were quantified using the PanCancer gene panel (n = 730) compiled and designated to different molecular pathways by nanoString Technologies. Only significant changes (p ≤ 0.05) of gene expressions were included into the pie charts: Number of significantly affected genes were in BT474: n = 275, in T-47D: 209, in HCC1806: 161

