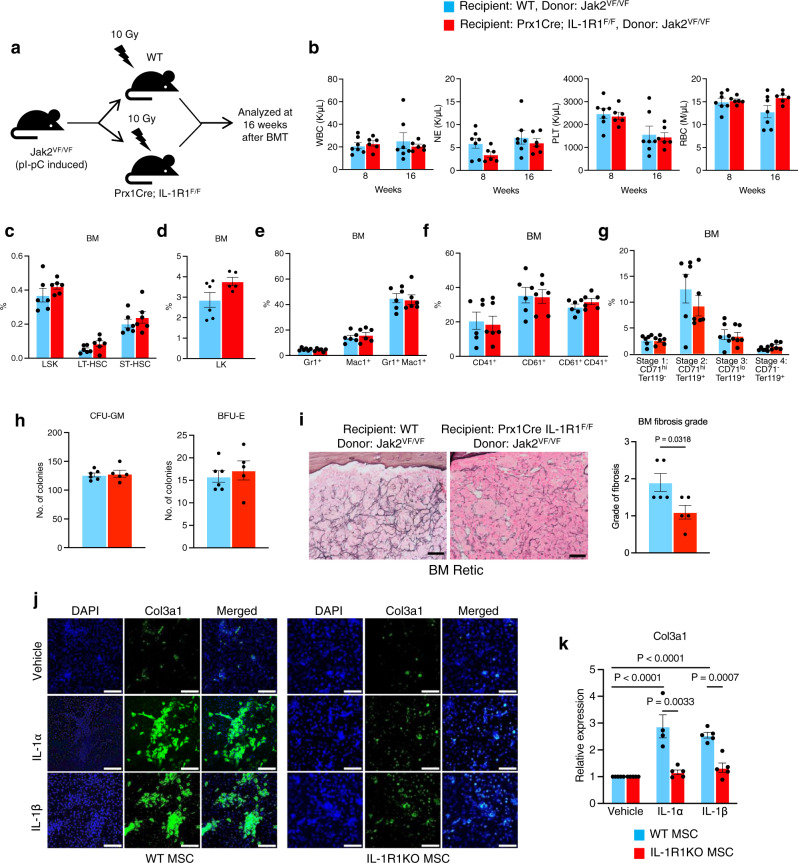
Fig. 4. Effects of IL-1R1 deletion in BM MSC on Jak2V617F-induced MPN.
a A scheme on the experimental design is depicted. b Peripheral blood WBC, NE, PLT, and RBC counts at 8 and 16 weeks after transplantation in WT (n = 7) and Prx1Cre; IL-1R1F/F recipient mice (n = 6). Data are shown as mean ± SEM. Statistical significance was determined using multiple unpaired two-tailed t-tests. c Frequencies of LSK (Lin− Sca1+ c-kit+), LT-HSC (Lin- Sca1+ c-kit+ CD34- CD135-) ST-HSC (Lin- Sca1+ c-kit+ CD34+ CD135-) and LK (Lin-c-kit+) in the BM of WT or Prx1Cre; IL-1R1F/F recipients at 16 weeks after transplantation (n = 6, 6). All bar graphs represent mean ± SEM. d Frequencies of LK (Lin-c-kit+) in the BM of WT or Prx1Cre; IL-1R1F/F recipients (n = 6, 5). e–g Percentages of Gr1+/Mac1+ (e), CD61+/CD41+ (f) and CD71/Ter119 (g) cells in the BM of WT and Prx1Cre; IL-1R1F/F recipients (n = 6, 6 mice). h CFU-GM and BFU-E colonies in the BM of WT and Prx1Cre; IL-1R1F/F recipients (n = 6, 5 mice). i Representative images of the reticulin staining of the BM sections from recipient mice at 16 weeks after transplantation. Scale bar, 20 μm. Histological grade of BM fibrosis in WT and Prx1Cre; IL-1R1F/F recipients is shown in bar graphs as mean ± SEM (n = 5 mice per group). Statistical significances were determined using two-tailed unpaired t-test. j Immunofluorescence images showing Col3a1 expression in WT and IL-1R1 KO BM MSCs upon IL-1α (5 ng/mL) and IL-1β (5 ng/mL) stimulation. Col3a1 (green) and DAPI (blue); scale bars, 100 µm. Representative images from 3 independent experiments are shown. k WT and IL-1R1 KO mice BM MSCs were treated with vehicle (PBS), IL-1α (5 ng/mL) or IL-1β (5 ng/mL) for 72 h. Col3a1 mRNA expression was determined by RT-qPCR. Fold change of Col3a1 expression is shown in bar graphs as mean ± SEM (n = 5, 4, 5 biological replicates for vehicle, IL-1α and IL-1β treatment in WT MSCs; n = 5, 5, 5 biological replicates for vehicle, IL-1α and IL-1β treatment in IL-1R1 KO MSCs). Statistical significance was determined in k using two-way ANOVA with Tukey’s multiple comparison test. Source data are provided as a Source Data file.

