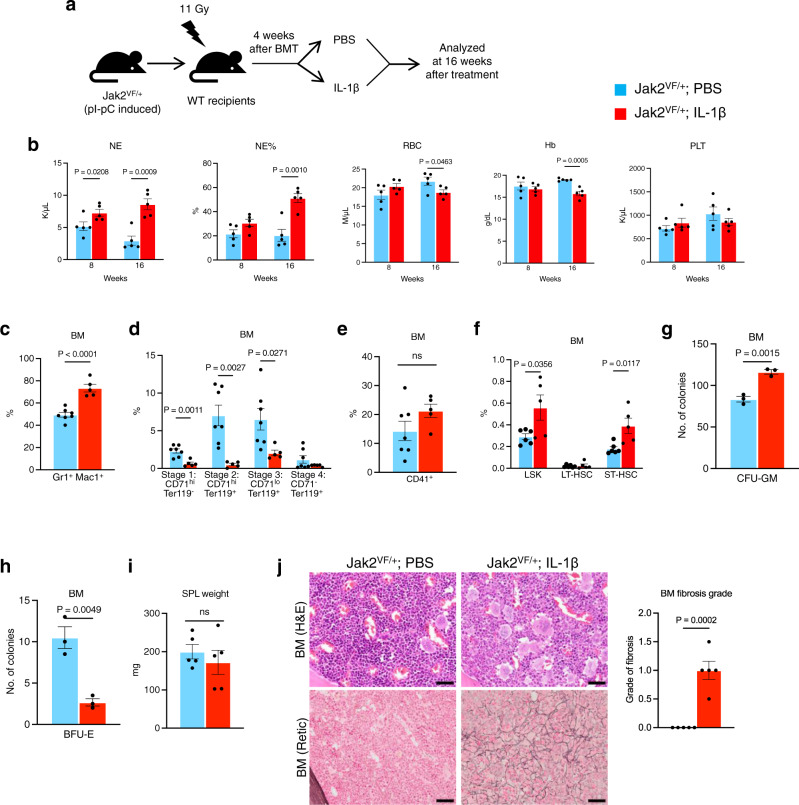
Fig. 5. Exogenous IL-1 treatment promotes the development of bone marrow fibrosis in Jak2V617F mice.
a A scheme on the experimental design is depicted. b Peripheral blood counts of neutrophil (NE), percentages of neutrophil (%NE), red blood cells (RBC), hemoglobin (Hb) and platelets (PLT) were assessed at 8 and 16 weeks after treatment (n = 5 mice per group). c–e Frequencies of Gr1+Mac1+, CD71+/Ter119+ and CD41+ cells in the BM of Jak2VF+ mice treated with PBS or IL-1β are shown in bar graphs as mean ± SEM (n = 7, 5 mice). f Frequencies of LSK (Lin− Sca1+ c-kit+), LT-HSC (Lin- Sca1+ c-kit+ CD34- CD135-) and ST-HSC (Lin- Sca1+ c-kit+ CD34+ CD135-) in the BM of Jak2VF+ mice treated with PBS or IL-1β are shown in bar graphs as mean ± SEM (n = 6, 5 mice). g, h BM cells (2 × 10⁴) from PBS or IL-1β treated Jak2VF+ mice were plated in methylcellulose medium (MethoCult 3434) with cytokines. Colony forming unit granulocyte-macrophage (CFU-GM) (g) and burst forming unit erythroid (BFU-E) (h) colonies are shown in bar graphs as mean ± SEM (n = 3 mice per group; each data point is an average of two technical replicates). i Spleen weights of Jak2VF+ mice treated with PBS and IL-1β (n = 5 mice per group). j Representative images of the hematoxylin and eosin (H&E) and reticulin stained BM sections from Jak2VF+ mice treated with PBS or IL-1β for 16 weeks. Scale bar, 20 μm. Histological grade of BM fibrosis (reticulin fibrosis) is shown in bar graphs as mean ± SEM (n = 5 mice per group). Statistical significances were determined in b–j using two-tailed unpaired t-test. Source data are provided as a Source Data file.

