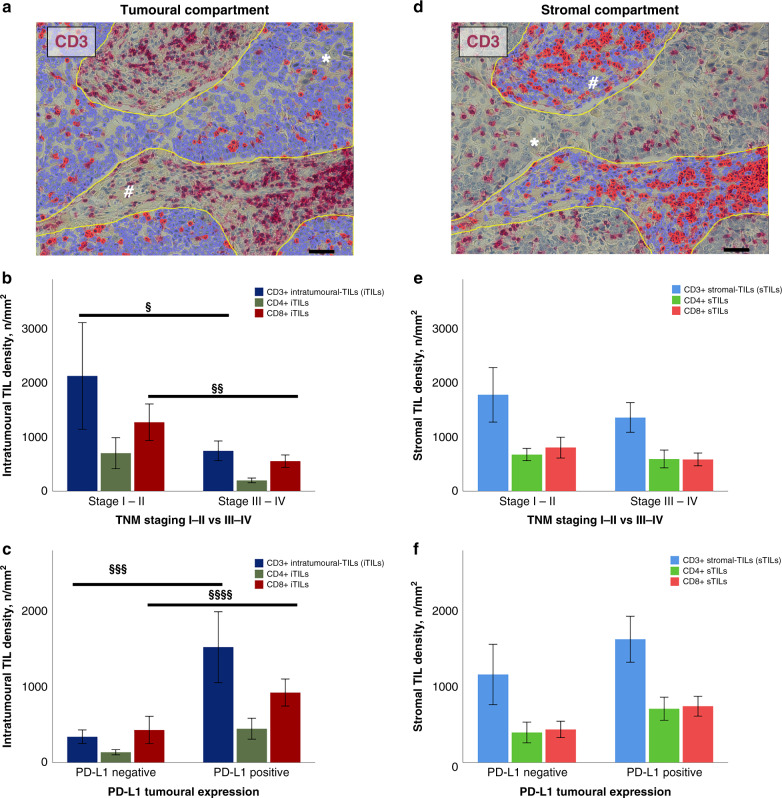
Fig. 3. Assessment of the spatial architecture of TILs using digital system.
Region of interest (ROI) corresponding to tumour area and automated detection of CD3-positive infiltrating lymphocytes (red dots, iTILs) (a). Stromal area selected within the ROI and following automated detection of CD3-positive infiltrating lymphocytes (red dots, sTILs) (d). Bar graphs showing the different spatial distribution of TILs according to TNM stage (§p = 0.04, §§p = 0.01) (b–e) and PD-L1 expression (§§§p = 0.006, §§§§p = 0.04) (c–f). Asterisks (*) indicate tumour cells. Hashes (#) indicate stromal tissue. Scale bars: 100 µm. iTIL intratumoural-infiltrating lymphocyte, PD-L1 programmed death ligand 1, ROI region of interest, sTIL stromal-infiltrating lymphocyte.

