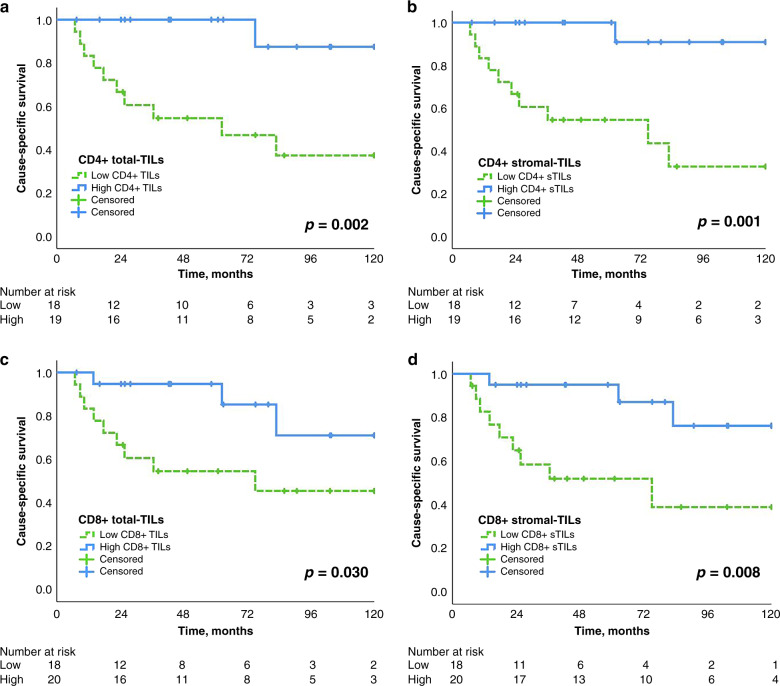
Fig. 4. Outcome analysis.
Kaplan–Meier survival curves showing the impact of density and localisation of CD4+, CD8+ CSS (a–d) in thymic carcinoma patients. The median of respective TIL density was used to dichotomise into high and low groups. Log-rank test p values as well as the number of patients at risk are indicated. CSS cause-specific survival.

