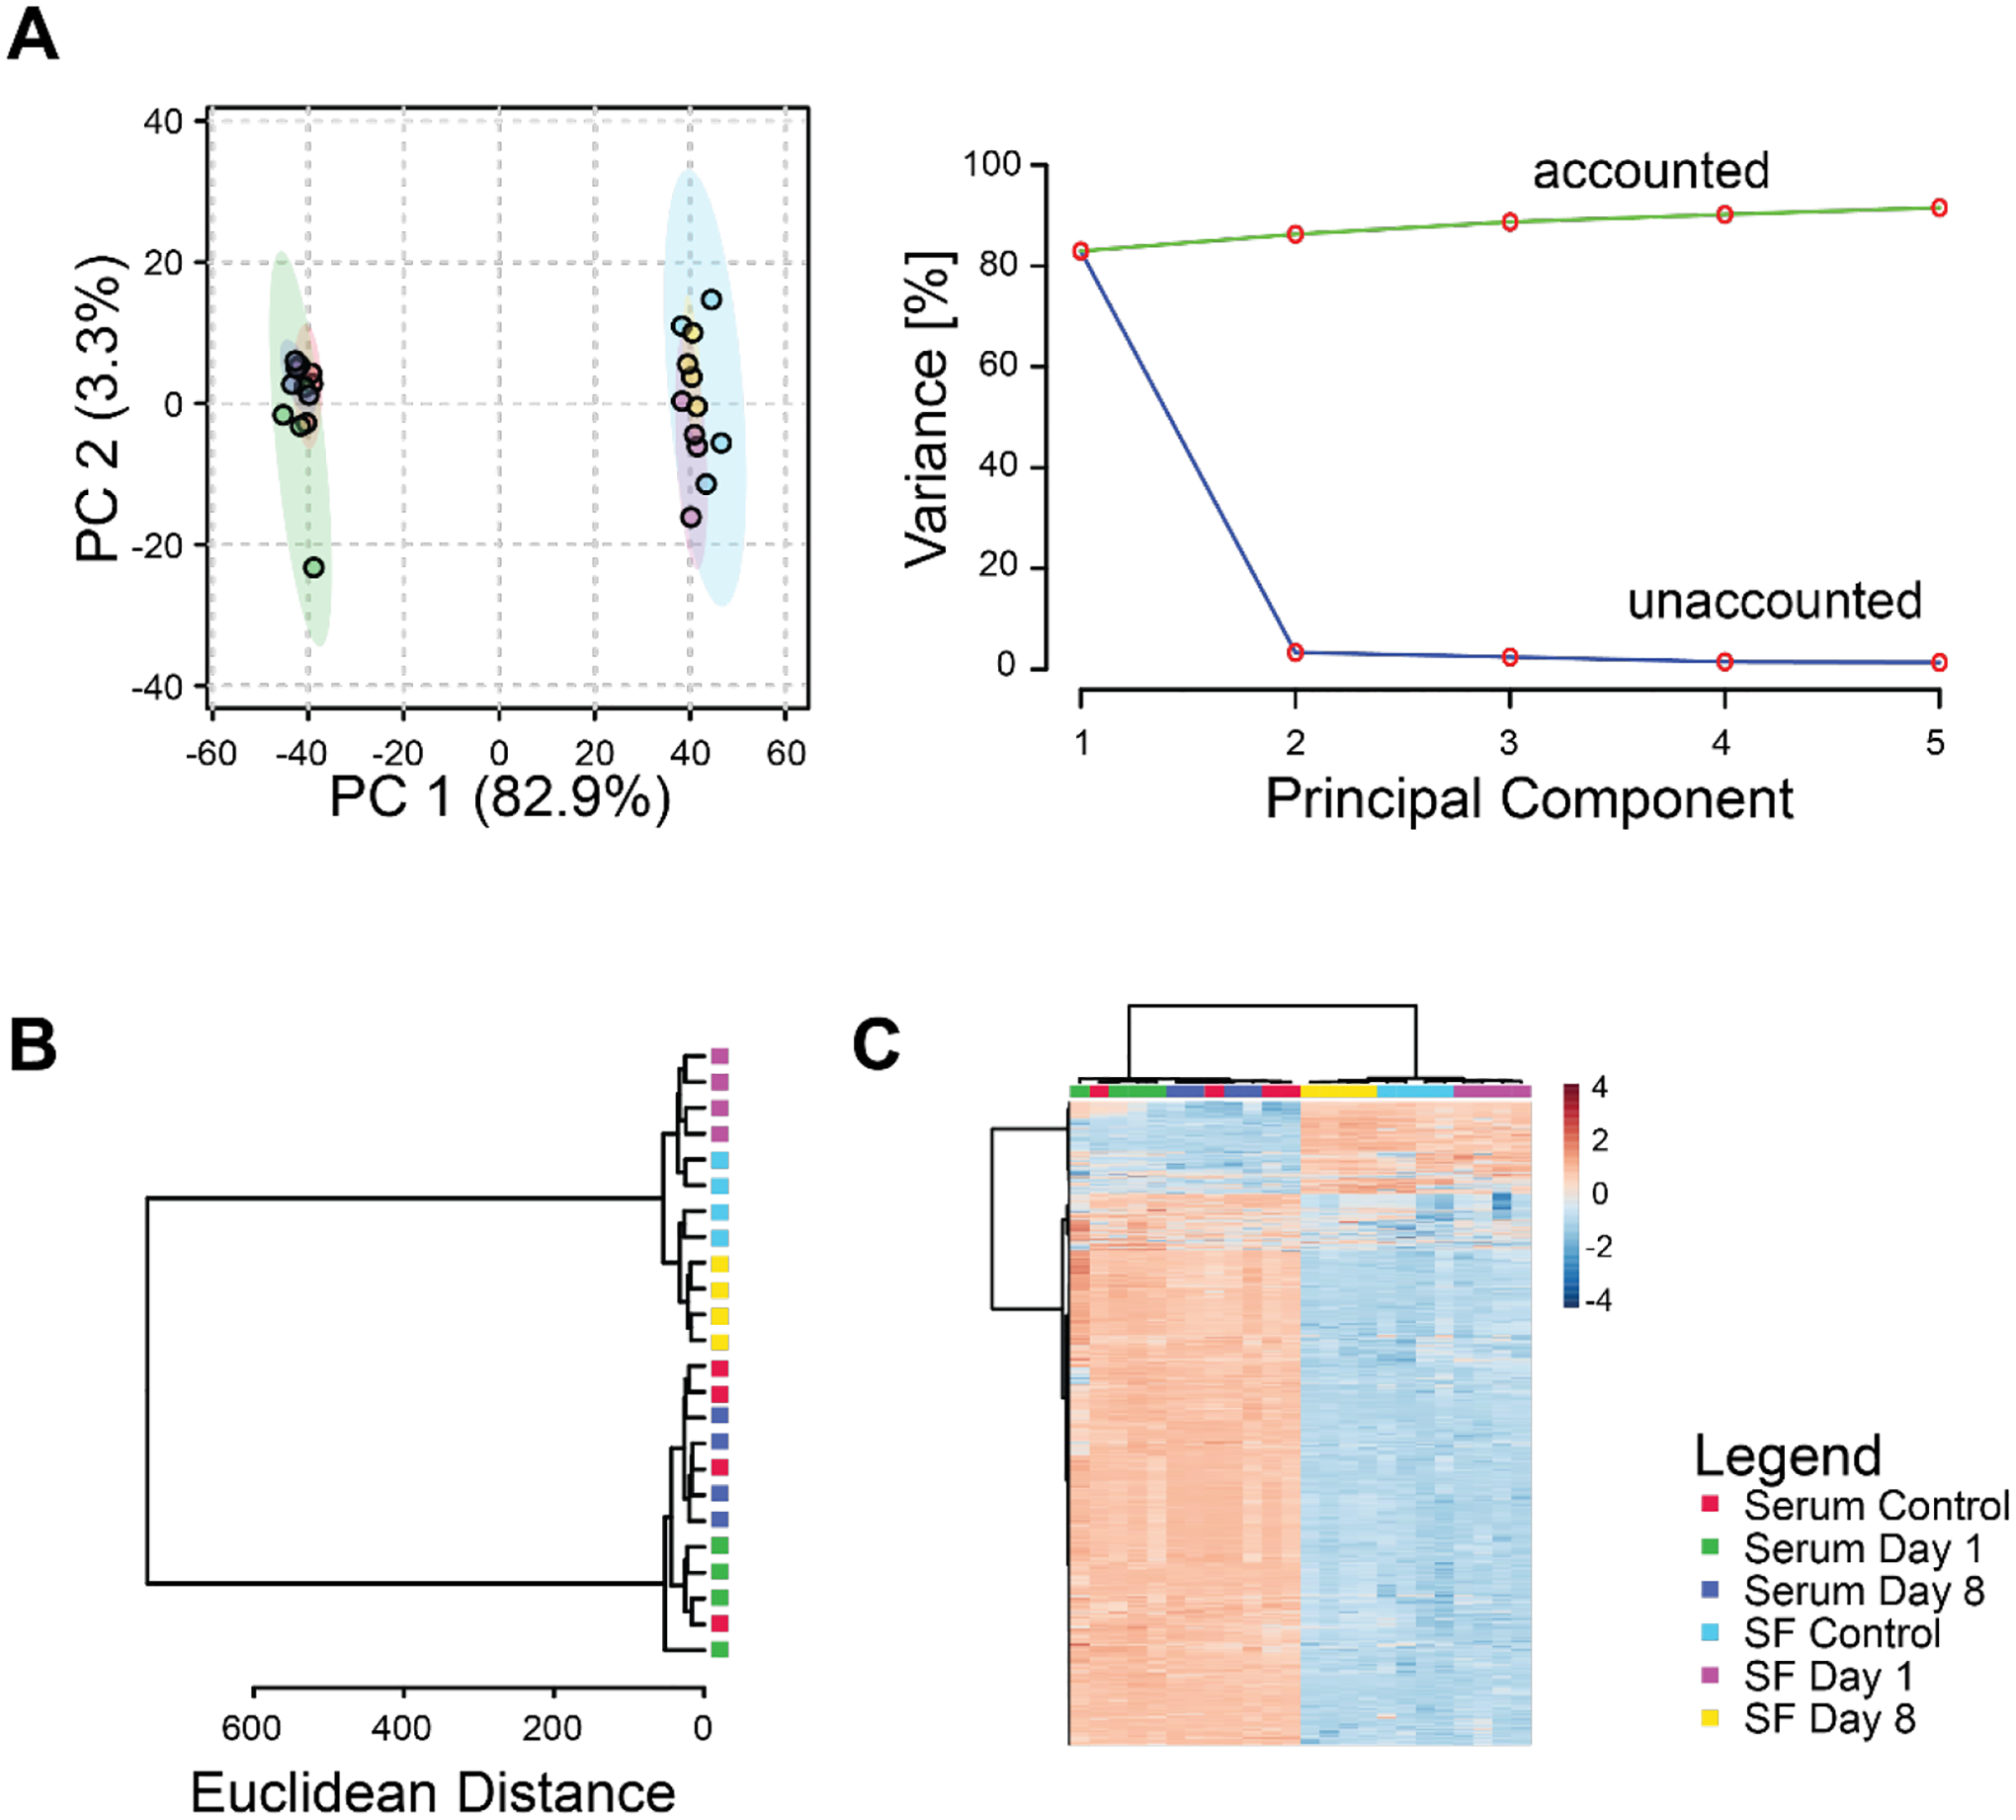
Figure 1.

Differences in global metabolomic profiles between serum and synovial fluid. (A) Principal components analysis. Left projection of data onto the first 2 principal components shows distinct separation between metabolomic profiles of serum and synovial fluid. Right: scree plot shows that most of the variance in the overall dataset is associated with the first principal component. (B) Dendrogram of cluster analysis using the Euclidian distance metric and Ward linkage function shows complete separation between serum and synovial fluid samples. Furthermore, the synovial fluid metabolomic profiles were completely separated between experimental groups in contrast to the serum profiles that were not. (C) Heatmap of clustered metabolite intensities shows patterns of metabolite up- and down-regulation between experimental groups.
