
Figure 2.
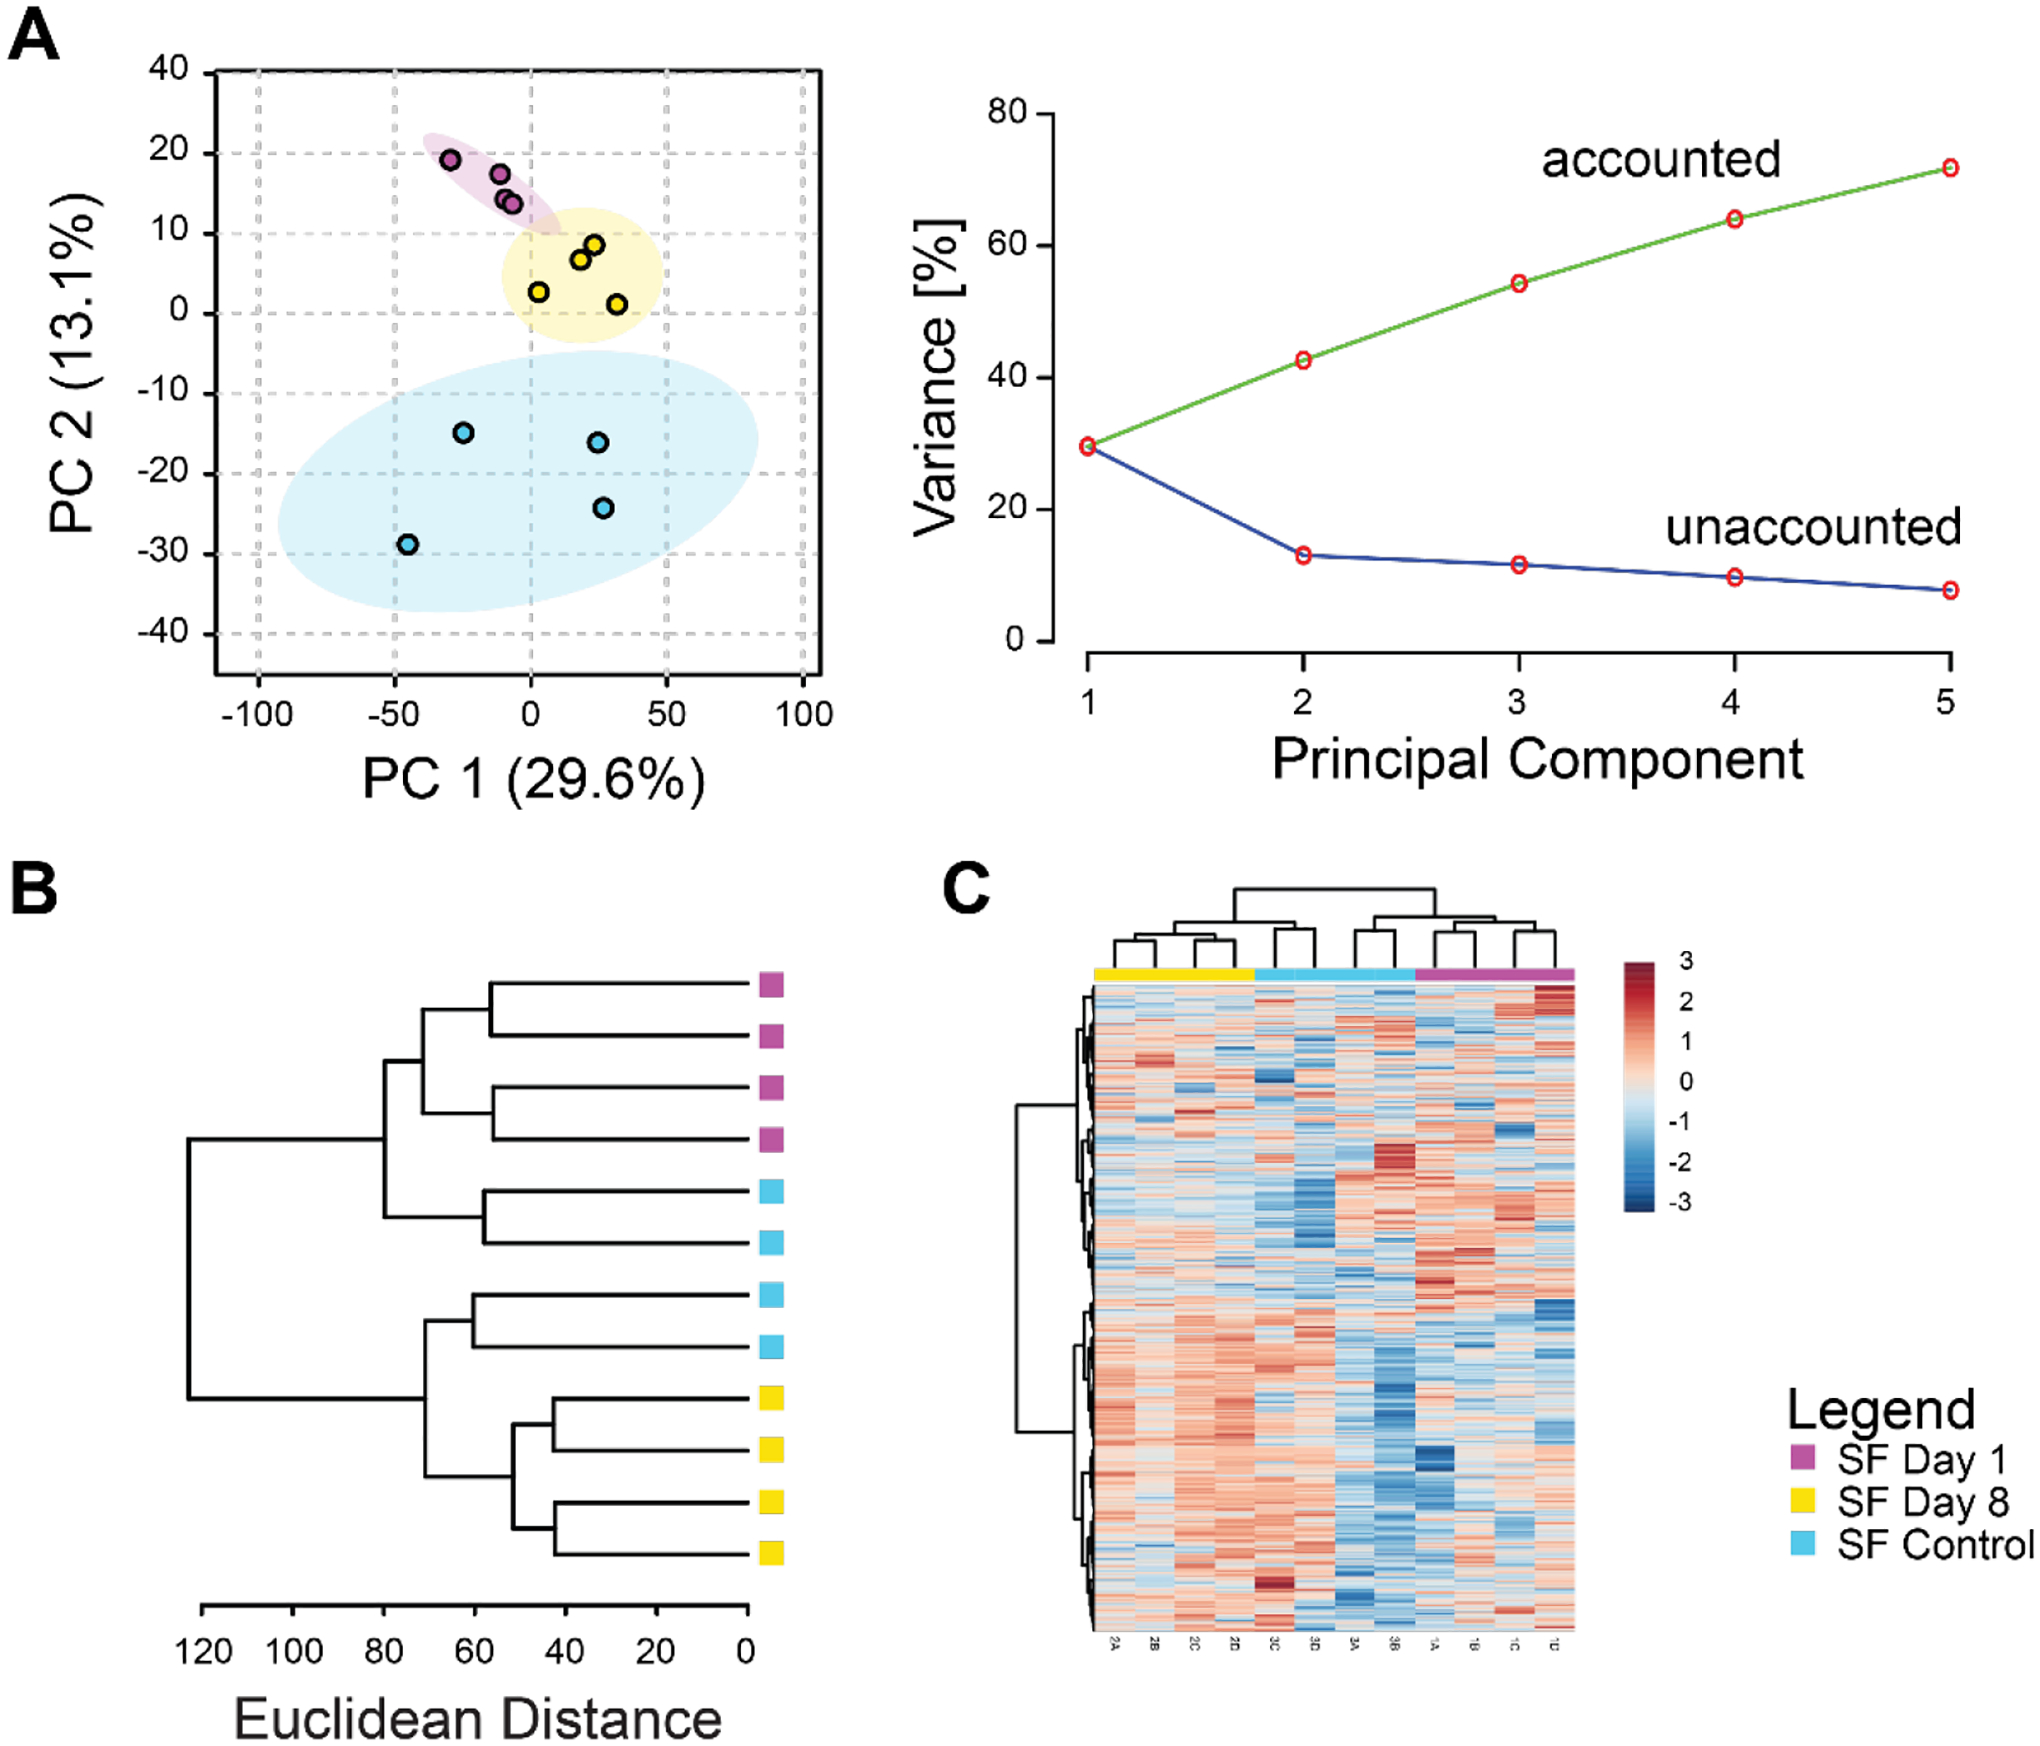
Synovial fluid metabolomic profiles capture changes induced by injury. (A) Principal components analysis. Left projection of data onto the first 2 principal components shows distinct separation between metabolomic profiles of control, 1-day post-injury, and 8-day post-injury synovial fluid. Right: scree plot showing that increasing the number of principal components results in increased modeled variance in the overall dataset. (B) Dendrogram of cluster analysis using the Euclidian distance metric and Ward linkage function shows complete separation between days 1 and 8 post-injury. (C) Heatmap of clustered metabolite intensities shows patterns of metabolite up- and down-regulation between experimental groups.