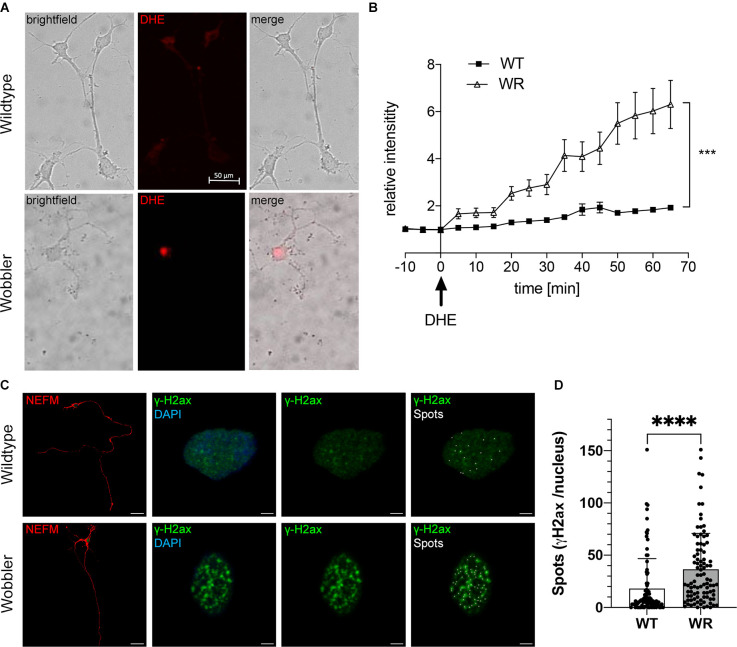
Figure 2.
Elevated ROS levels in motor neurons of Wobbler mice correlate with increased abundance of the DNA damage response protein γH2ax. (A) Exemplary images of dissociated motor neurons from wild-type and Wobbler animals (p40+10div) 65 min after DHE (red fluorescence) addition and live cell imaging. Live-cell imaging was performed using a spinning disc confocal microscope with a 20× objective. The fluorescence signals of the cells were documented every 5 min for 1 h in DHE-including medium, 37°C and 5% CO2. Scale bar = 50 μm. (B) Relative red fluorescence intensity in five dissociated motor neuronal cell cultures from p40 wild-type and Wobbler mice documented in 5 min intervals of 20 cells per genotype. At timepoint 0 the normal medium was exchanged for DHE including medium. ImageJ 1.53f51 (National Institute of Health, USA) was used to analyze the average red fluorescence intensity within the soma of a motor neuron, while motor neurons themselves were detected in transmitted-light channel. A mean value of background fluorescence intensity without DHE addition was used for normalization. Data are provided as means ± SEM. Data were tested for significance using two-way ANOVA with a Sidak post-hoc test. Significant differences are indicated by ***p < 0.001, n = 20 cells from five dissociated cultures per genotype. (C) Exemplary images of wild-type and Wobbler motor neurons (p40+10div) stained with anti-NEFM antibody (red), anti-phospho-Histone H2A.X (green) and DAPI (blue). The overview images (1st row) show an exemplary motor neuron, with rows 2–4 focusing on the nucleus (blue) of the exemplary cell to see the H2ax signals (green) and spots (white) created using Imaris 9.3.1. Pictures were taken with a confocal fluorescent microscope equipped with a 40× oil objective. Scale bar (1st row) = 30 μm. Scale bar (2nd–4th raw) = 2 μm. (D) Detected spots of γH2ax staining in wild-type and Wobbler motor neuronal cell nuclei. Wobbler mice show a significantly higher number of spots with an average of 36.56 while wild-type motor neurons have an average number of spots of 18.09. Data are provided as means ± SD including individual data points. Data were tested for significance using Student’s t-test. Significant differences are indicated by ****p < 0.0001, n = 90–94 nuclei per genotype of a least five experiments.

