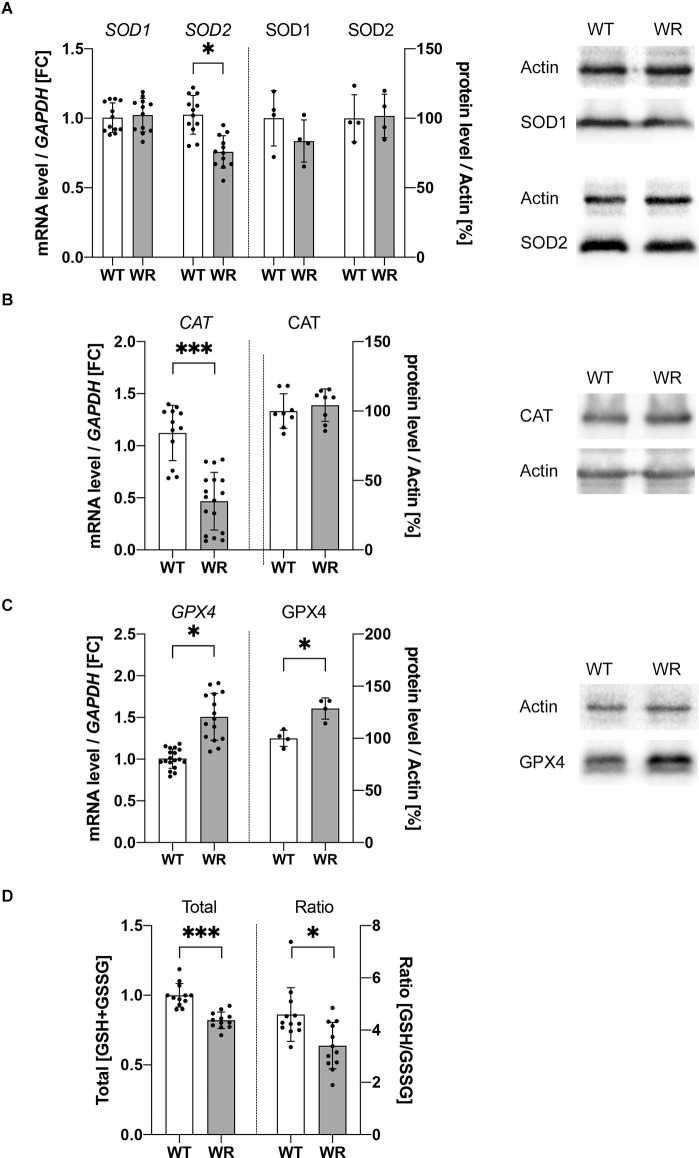
Figure 3.
Dysregulated expression of ROS detoxifying molecules in cervical Wobbler spinal cord. (A–C) mRNA and protein expression levels of SOD1 and 2 (A), CAT (B), and GPX4 (C) at stable clinical stage (p40) in cervical spinal cord of wild-type (WT) and Wobbler (WR) mouse. For relative quantification of mRNA level, the 2−ΔΔCt method was conducted using GAPDH for normalization. For semiquantitative analysis of protein expression levels, arithmetic analysis of the band intensity with ImageJ 1.53f51 (National Institute of Health, USA) software was used. Band intensities of proteins of interest were normalized to the housekeeper actin. Normalized protein levels were compared between different genotypes. All data are presented as the mean values ± SD including individual data points, and Student’s t-test was performed for significance testing between WT and WR. Significant differences are indicated by *p < 0.05, ***p < 0.001, n(qPCR) = 5; n(WB) = 4–8. (D) The total amount of reduced and oxidized glutathione was measured in the spinal cord of 40-days old wild-type and Wobbler mice using a GSH/GSSG detection assay kit. Total [GSH+GSSG] was normalized to WT. Using the same GSH/GSSG detection assay kit a significantly decreased ratio of [GSH/GSSG] could be detected in Wobbler spinal cord compared to wild-type spinal cord. All data are presented as the mean values ± SD including individual data points, and Student’s t-test was performed for significance testing between different genotypes. Significant differences are indicated by *p < 0.05, ***p < 0.001, n = 12.

