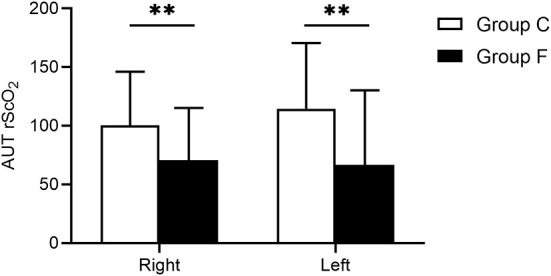
Figure 3.

The left and right AUT rScO2 of baseline rScO2 values in Group F and Group C. All data are presented as mean ± SD, **P < 0.01 vs. Group C. AUT rScO2, the area under the threshold of rScO2 readings.

The left and right AUT rScO2 of baseline rScO2 values in Group F and Group C. All data are presented as mean ± SD, **P < 0.01 vs. Group C. AUT rScO2, the area under the threshold of rScO2 readings.