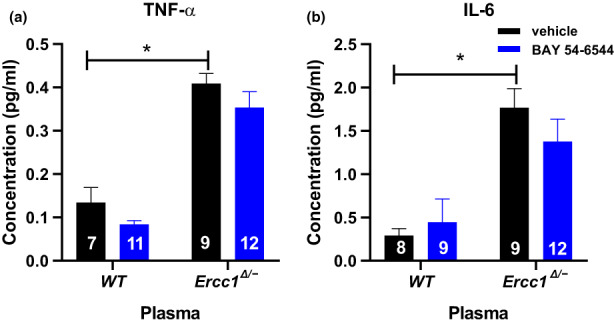
FIGURE 4.

Plasma levels of IL‐6 (pg/ml) and TNF‐alpha in samples in WT and Ercc1 Δ/− mice treated either with vehicle or BAY 54–6544 for IL‐6 (a) and TNF‐α (b). Data are presented in mean ± SEM. Statistical differences were analyzed by two‐way ANOVA followed by Bonferroni's post hoc test (* = p < 0.05).
