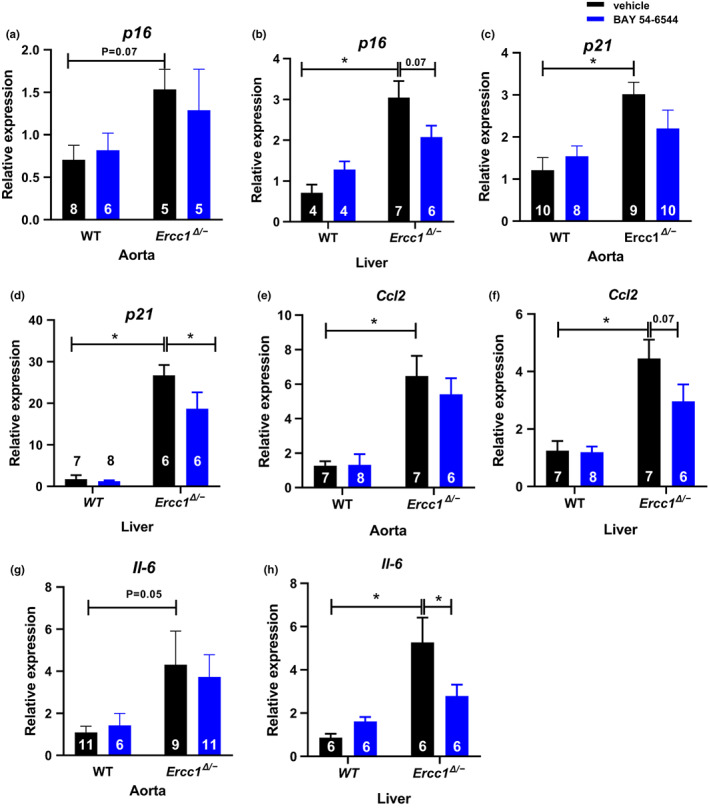
FIGURE 5.

Gene expression of WT and Ercc1 Δ/− mice treated either with vehicle or BAY 54–6544 for p16 in aorta (a), p16 in liver (b), p21 in aorta (c), p21 in liver (d), Ccl2 in aorta (e), Ccl2 in liver (f), Il‐6 in aorta (g), and Il‐6 in liver (h). Data are presented in mean ± SEM. Statistical differences were analyzed by two‐way ANOVA followed by Bonferroni's post hoc test (* = p < 0.05)
