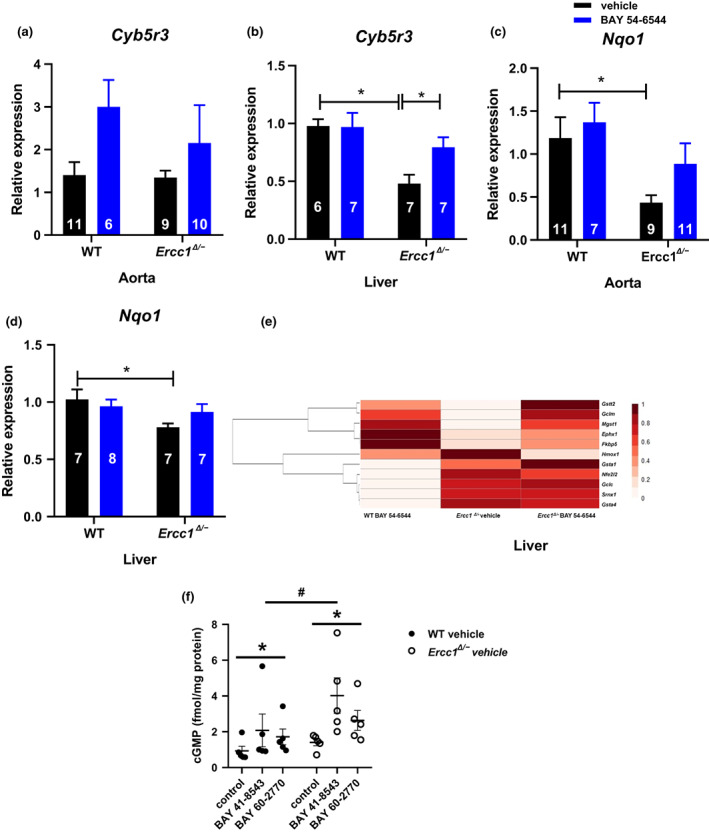
FIGURE 6.

Gene expression of WT and Ercc1 Δ/− mice treated either with vehicle or BAY 54–6544 for Cyb5r3 in aorta (a) and liver (b), and for Nqo1 in aorta (c) and liver (d). Data are presented in mean ± SEM. Statistical differences were analyzed by two‐way ANOVA followed by Bonferroni's post hoc test (* = p < 0.05). Heatmap of fold changes in mRNA expression of key antioxidant defense genes in liver of WT BAY 54–6544, Ercc1 Δ/− vehicle and Ercc1 Δ/− BAY 54–6544 treated mice against WT vehicle‐treated group. The intensity of color from light to dark shows an increasing pattern of expression. Hierarchical clustering on liver antioxidant genes was performed using Pearson correlation. (e). cGMP production levels in liver tissue from vehicle‐treated WT vs. Ercc1 Δ/− mice when given ex vivo BAY 41–8543 and BAY 60–2770 for 30 minutes in organ baths in the presence of 10−4 Mol/L IBMX (f); data are presented in mean ± SEM. Statistical differences were analyzed by, Friedman test; interaction genotype x treatment: P = NS, two‐way ANOVA
