FIGURE 1.

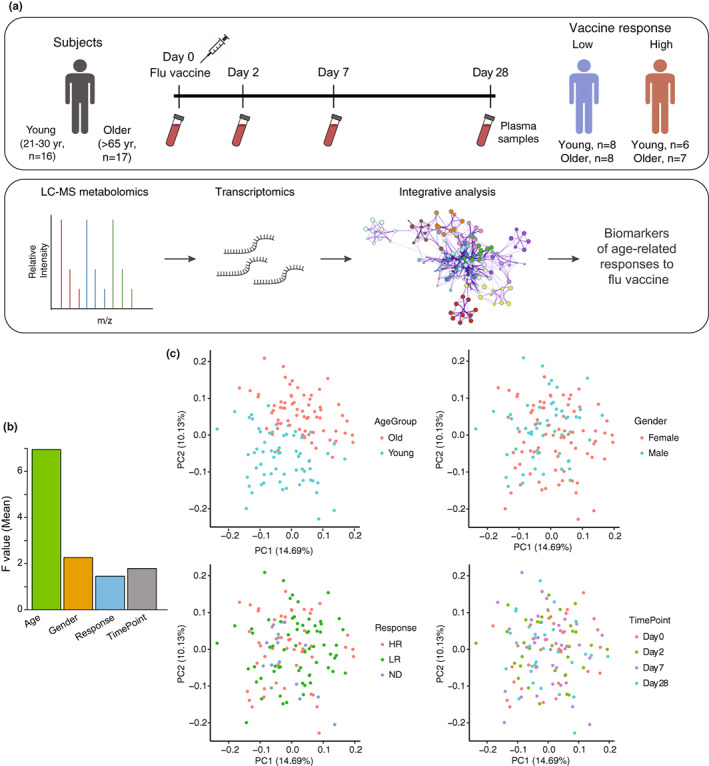
Study design and global characterization of plasma metabolome profiles. (a) Blood plasma samples from a total of 33 subjects (16 young (age 21–30 years) and 17 older (age ≥65)) were collected prior to vaccination (Day 0) and at 2, 7, and 28 days post‐vaccination. Subjects were classified as high responders (HR) or low responders (LR) by HAI titers (see Section 4) at 28 days post‐vaccination using maxRBA (Avey & Mohanty, 2020). Metabolite abundance in plasma was assessed using high‐throughput profiling by LC–MS‐based metabolomics, and gene expression levels in PBMCs were assessed using high‐throughput profiling by Illumina beadChips microarray as previously reported (Thakar et al., 2015). Finally, computational and integrative analyses of the metabolomics and transcriptomics datasets were performed. (b) The effect of factors such as age, gender, response, and timepoint and their interactions on the variation of plasma metabolite abundance in the study cohort. F value determined by one‐way ANOVA. (c) Sampleto‐sample variation in plasma metabolomics revealed by principal component analysis (PCA). Each dot represents a sample, colored by age, gender, response, and time point, respectively.
