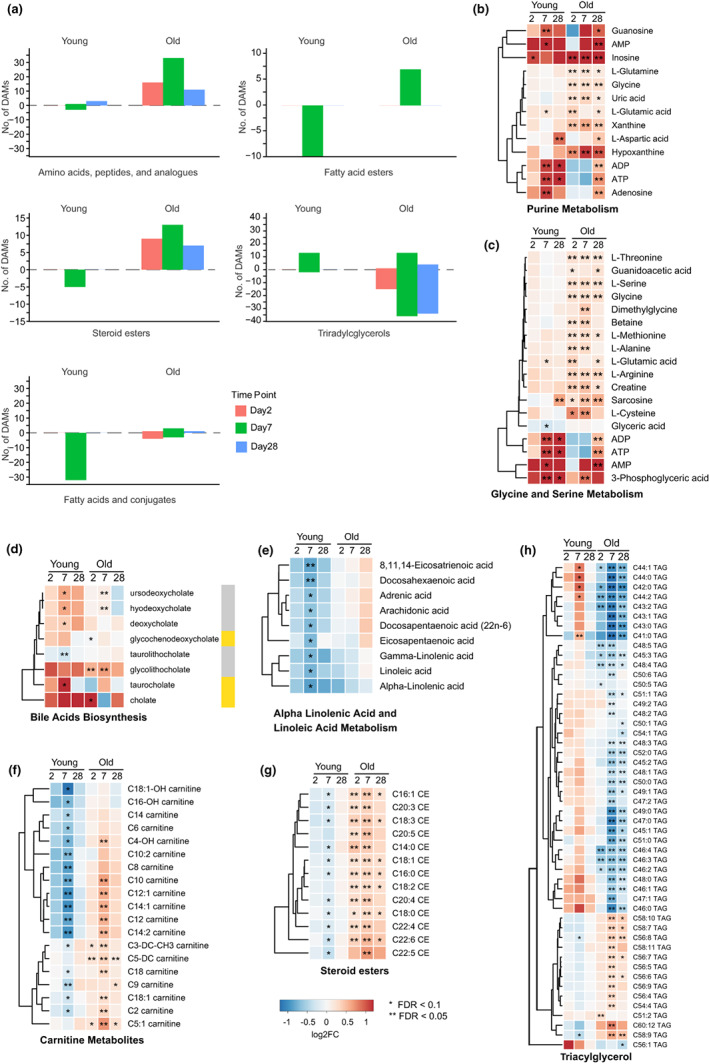
FIGURE 2.

Differential molecular signatures induced by flu vaccination in young and old groups. (a) Differentially abundant metabolite levels (absolute value of fold change ≥1.2, p < 0.05, and FDR < 0.2) at Day 2, Day 7, and Day 28 post‐vaccination relative to Day 0 in young and old groups. Selected metabolite classes are shown. Molecular signatures in the following pathways show similar trends in young and older groups: (b) purine metabolism, (c) glycine and serine metabolism, (d) bile acid biosynthesis. Molecular signatures in the following pathways show differing trends in young and older groups: (e) alpha‐linolenic acid and linoleic acid metabolism, (f) steroid esters, (g) carnitine metabolites and (h) triacylglycerol. Results for AMP, ADP, and ATP appear in both (b) and (c) as they are members of both pathways. Color labels correspond to indicated log2FC. Gold color labels in the right of panel d represent the primary bile acids and gray color labels represent the secondary bile acids. *FDR < 0.1, **FDR < 0.05.
