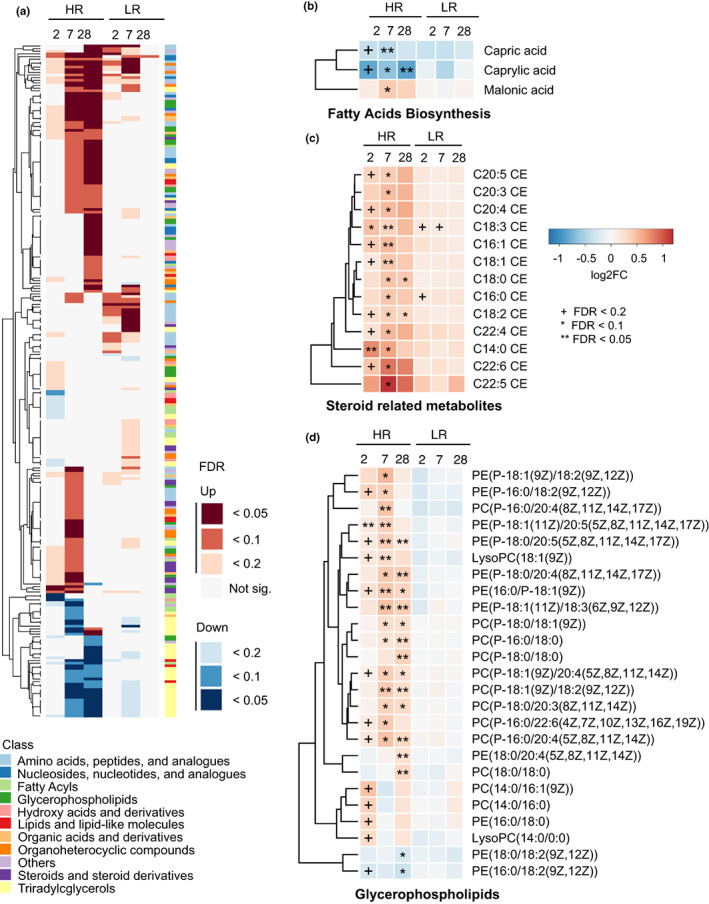
FIGURE 4.

Molecular signatures associated with response to vaccination in older subjects. (a) Differentially abundant metabolite levels (absolute value of fold change ≥1.2, p < 0.05, and FDR < 0.2) at Day 2, Day 7, and Day 28 post‐vaccination relative to Day 0 in HR and LR groups. (b–d) Molecular signatures for the top differential metabolic pathways in old HR and LR: fatty acid biosynthesis, cholesteryl esters, and glycerophospholipids. Color labels correspond to indicated log2FC. +FDR < 0.2, *FDR < 0.1, **FDR < 0.05.
