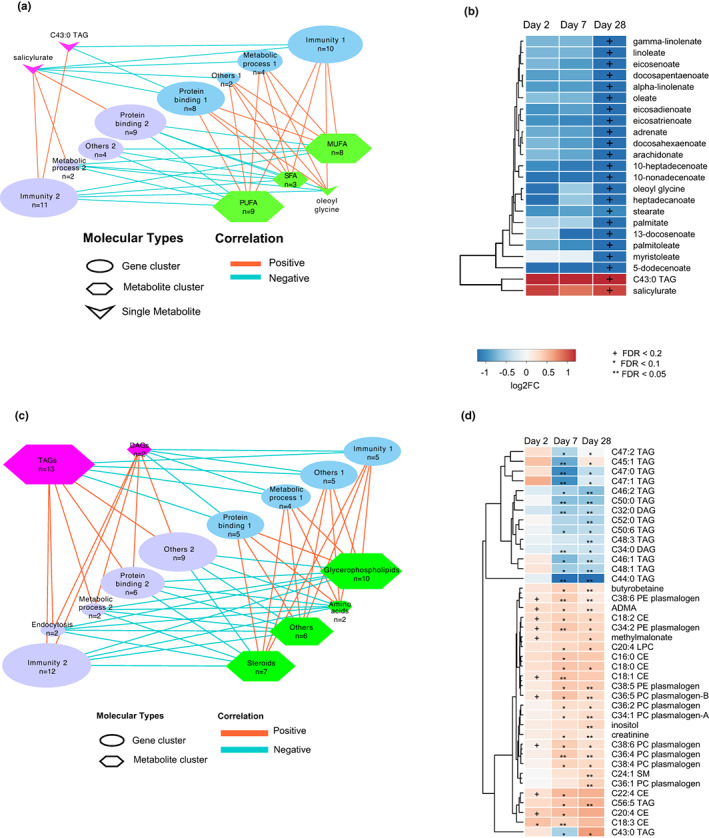
FIGURE 5.

Integrated metabolomic and transcriptomic correlation and network in young and older high responders. Sparse Partial Least Squares Regression (sPLS) was used for simultaneous variable selection in the transcriptomics and metabolomics data sets in young (a, b) and older (c, d) HR. (a, c) Correlation networks of genes categorized by function and metabolites categorized by class. (b) Differentially abundant metabolites from (a). (d) Differentially abundant metabolites from (c). +FDR < 0.2, *FDR < 0.1, **FDR < 0.05.
