
FIGURE 1.
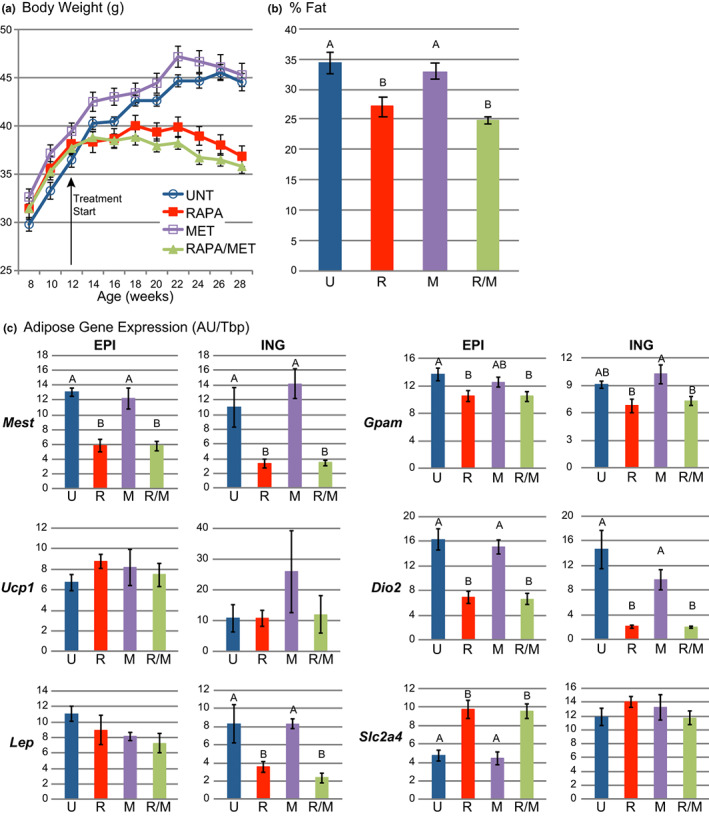
RAPA‐ and RAPA/MET‐treatments reduced obesity. (a) RAPA‐ and RAPA/MET‐treatments prevented adult weight gain typical of NcZ10 males (p < 0.0001, repeated measures MANOVA for both RAPA and RAPA/MET vs. UNT). MET‐ treatment had no effect. (b) RAPA‐ and RAPA/MET‐treatments significantly reduced body fat, determined by DXA. (c) RAPA‐ and RAPA/MET‐treatments reduced Mest and Gpam expression in both fat pads. While Ucp1 expression was unaffected, RAPA‐ and RAPA/MET‐treatments reduced Dio2 in both fat pads. Treatment effects on Lep expression mirrored effects on fat pad weight in both fat pads. RAPA‐ and RAPA/MET‐treatments increased Slc2a4 expression in EPI, but not ING fat. Values are mean ± SE. All multiple comparisons are significant at p ≤ 0.05 (Tukey‐ Kramer). N = 9–10 mice per treatment except N = 4 mice per treatment for % Fat and ING fat gene expression. Within each histogram, treatment groups not annotated by the same superscript letter are significantly different at p < 0.05 (Tukey–Kramer HSD). Untreated = UNT and U, RAPA‐treated = RAPA and R, MET‐treated = MET and M, RAPA/MET‐treated = RAPA/MET and R/M