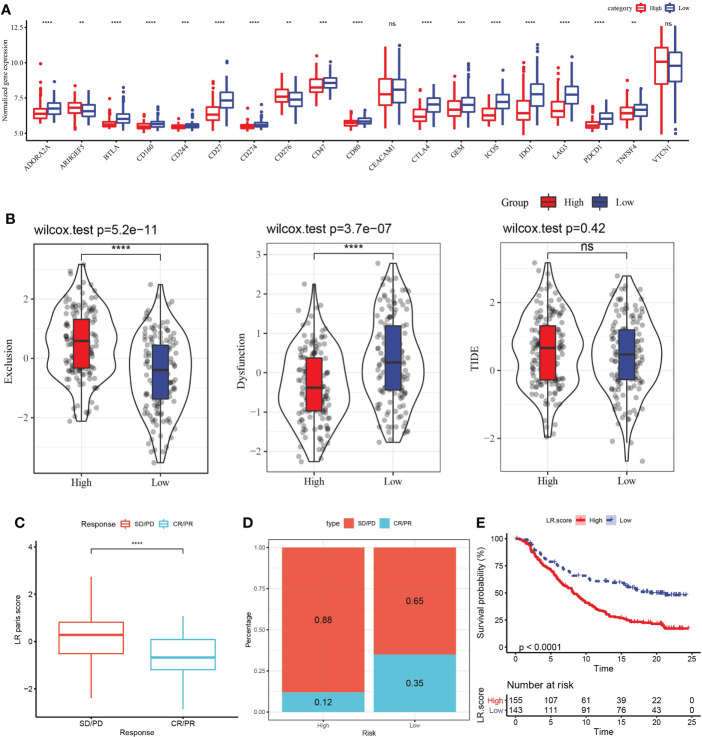
Figure 8.
Evaluation of the relationship between LR pairs score model and ICI treatment. (A) The association between LR pairs score and gene expression of immune checkpoints, Wilcoxon test. (B) The correlation between LR pairs score model and exclusion score, dysfunction score and TIDE score predicted by TIDE method, Wilcoxon test. (C) LR pairs score statistical difference between complete response (CR)/partial response (PR) group and stable disease (PD)/progressive disease (PD) group in IMvigor210 cohort. (D) The survival curve of different LR pairs score groups in the IMvigor210 cohort. (E) Response to anti-PD-L1 treatment in patients with different LR pairs score in the IMvigor210 cohort, Log rank test. The asterisks represented the statistical p value, ns(no significance) **p < 0.01, ***p < 0.001, ****p < 0.0001.

