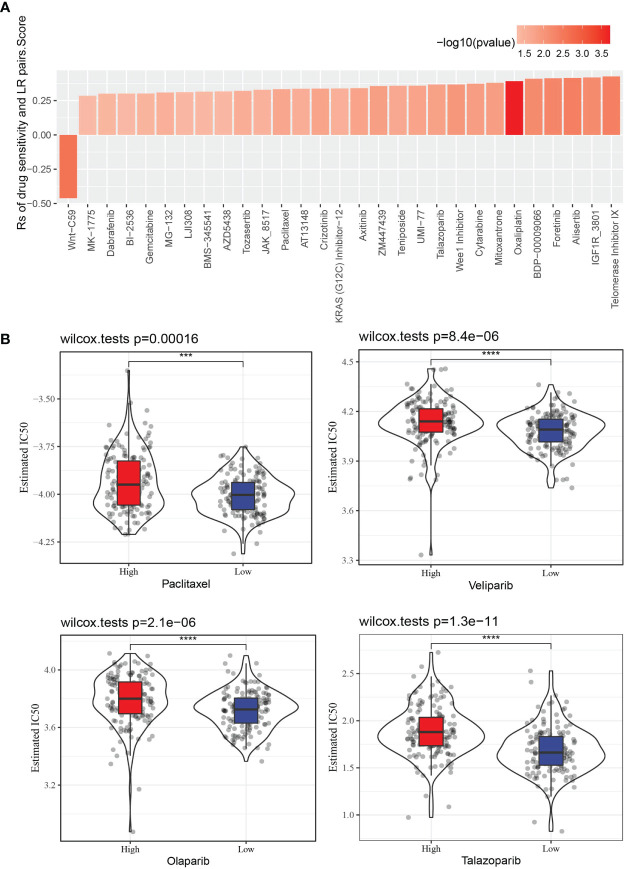
Figure 9.
The relationship between LR pairs score and drug sensitivity. (A) The correlation between LR pairs score and AUC of drug-sensitive curve, Spearman correlation analysis. (B) The violin plot dispalys the differences in the estimated IC50 values of Paclitaxel, Veliparib, Olaparib, Talazoparib between distinct LR pairs score groups, wilcoxon test. The asterisks represented the statistical p value, ***p < 0.001, ****p<0.0001.

