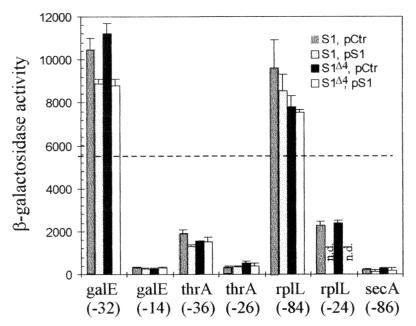
FIG. 4.
Histograms showing the activities of the different TIRs listed in Fig. 3 (except rpsA TIR) as measured by the β-galactosidase activity resulting from their fusion to lacZ (Fig. 1). Each group of four vertical bars (from left to right; S1, pCtr; S1, pS1; S1Δ4, pCtr; S1Δ4, pS1) illustrates the activity of a given TIR when the chromosomal rpsA gene is either wild type or ssyF (i.e., encodes either the full-length [S1] or the truncated [S1Δ4] protein and the cell contains either plasmid pACYC184 [pCtr] or the same plasmid carrying the wild-type rpsA gene [pS1]). Below each group of four bars is indicated the gene from which the TIR originates and the 5′ boundary of the particular fragment used as TIR (Fig. 3). Given β-galactosidase activity (in nanomoles of ONPG hydrolyzed per minute per milligram of total protein) is the average of two to five experiments. n.d., not determined. The horizontal dotted line corresponds to the β-galactosidase expression observed with the genuine lacZ TIR in rpsA+ cells lacking any plasmid (5,600 U) (43).

