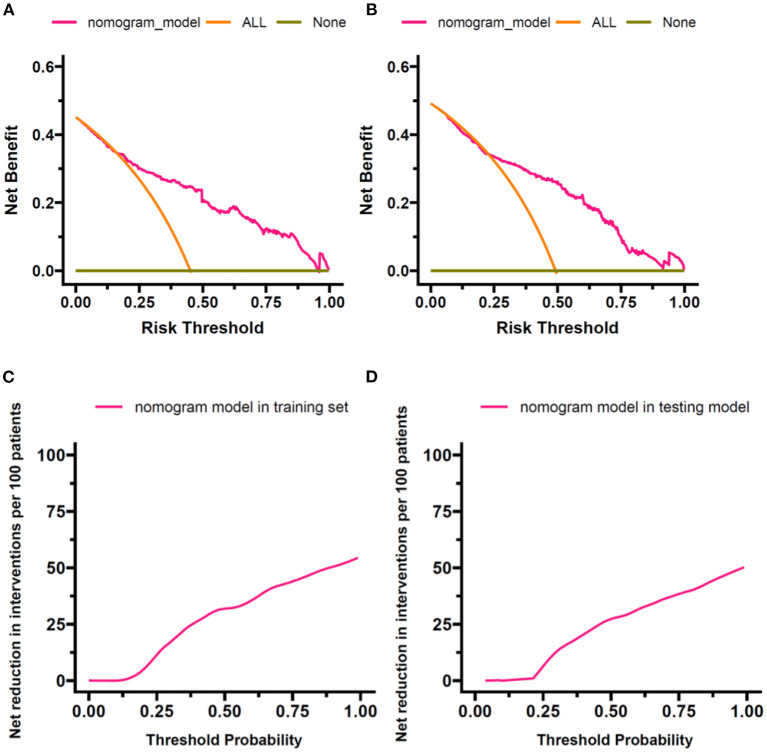
Figure 5.
Results of DCA. DCA was performed to compare the nomogram-based decision with default strategies, which assume that all or no observations received interventions. (A) Net benefit against threshold probability in the training set. (B) Net benefit against threshold probability in the testing set. (C) Net reduction in interventions per 100 patients against threshold probability in the training set. (D) Net reduction in interventions per 100 patients against threshold probability in the testing set. DCA, decision curve analysis.

