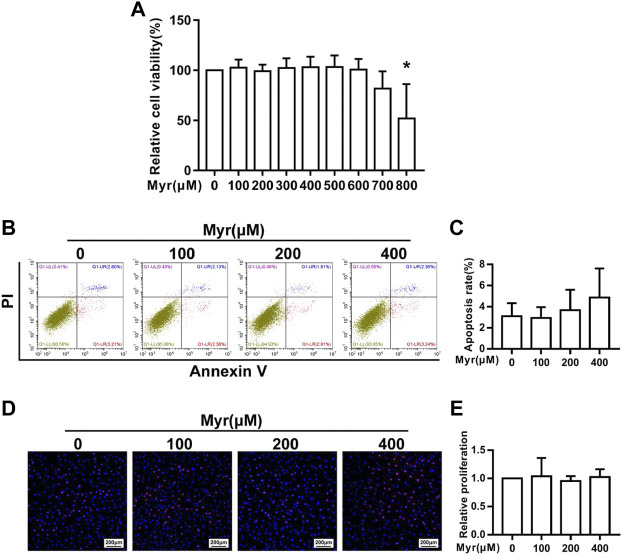
FIGURE 1.
Effect of Myr on the viability, proliferation and apoptosis of RA FLSs. The cells were treated with Myr at different concentrations (0–800 μM) for 24 h. (A)The CCK-8 assay was used to detect the cell viability. (B,C) Effect of Myr on the apoptosis of RA FLSs. Cell apoptosis was detected by a flow cytometry-based Annexin V-APC/PI assay. Representative images are shown. (D,E) Effect of Myr on the proliferation of RA FLSs. Cell proliferation was assessed by the EdU assay. Representative images are shown (original magnification, ×100). The data are expressed as the mean ± SD from at least 3 independent experiments. * p < 0.05 versus DMSO group.

