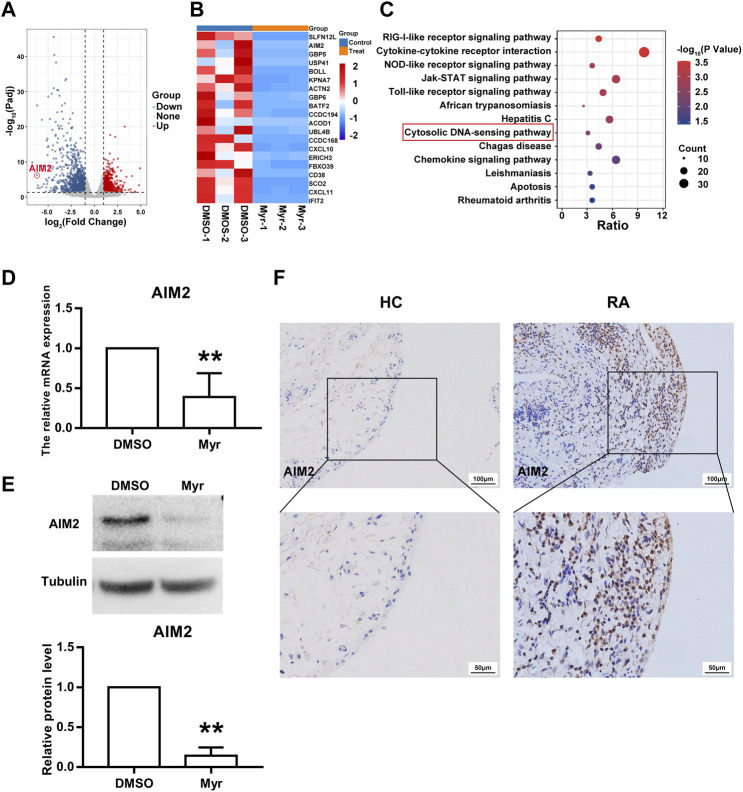
FIGURE 3.
AIM2 is identified as a target of Myr. (A) Volcano plot indicated up-regulated and down-regulated gene (Padj<0.05 and |log2FC| >1) by RNA sequencing in Myr-treated versus DMSO-treated RA FLSs from 3 patients. (B) Heatmap of the top 20 differentially expressed genes (DEGs). (C) Bubble plot of the top 13 enriched KEGG pathways of DEGs. (D,E) Myr downregulated the gene and protein expression of AIM2 by using RT-qPCR (D) and Western blot (E). Data are presented as the mean ± SD from at least 3 independent experiments. (F) Immunohistochemistry staining was used to measured AIM2 expression in synovial tissues from RA patients and HC subjects. Original magnification, ×200. ** p < 0.01 versus HC.

