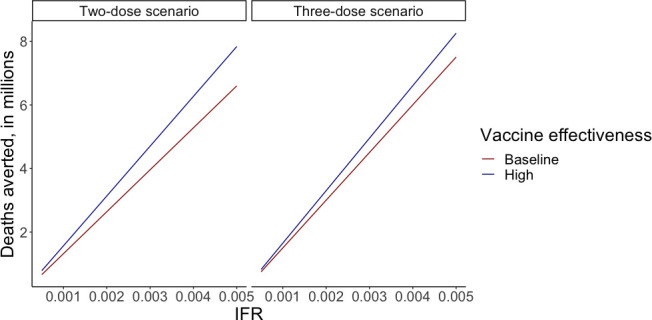
Figure 2.

Sensitivity analysis looking at deaths averted of vaccination LIC/LMIC, ranging IFR and vaccine effectiveness against mortality in the two-dose scenario (first panel) and three-dose scenario (second panel). The y-axis shows deaths averted, in millions. The x-axis shows IFR. dark red lines show baseline vaccine effectiveness (80% in two-dose scenario and 90% in three-dose scenario), and dark blue lines show high vaccine effectiveness (95% in two-dose scenario and 99% in three-dose scenario). IFR, infection fatality ratio; LIC, low-income country; LMIC, lower-middle income country.
