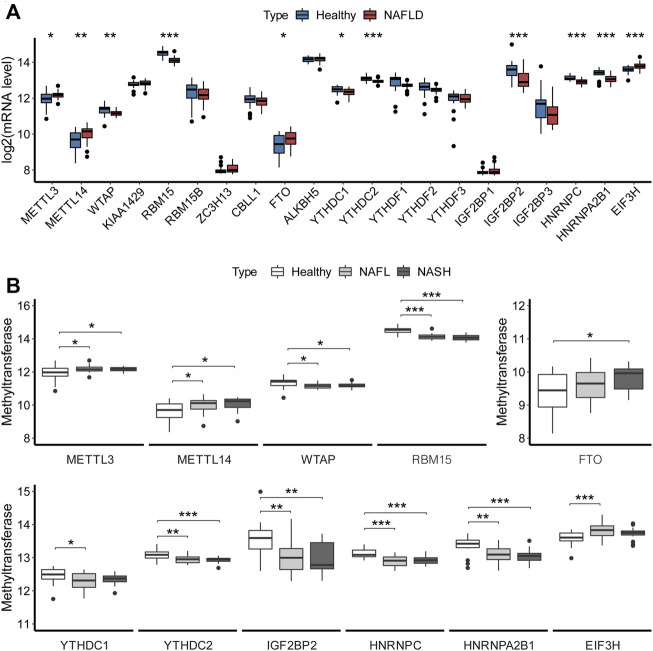
FIGURE 1.
Overview of expression of m6A regulators in NAFLD. (A) Expression levels of m6A regulators in liver tissues. The t-test analyzed the difference in the expression levels of m6A regulators between the healthy and NAFLD tissues. (B) Boxplot showed the association of expression with clinical stages for m6A regulators. Turkey’s post hoc test was used for comparison between groups to analyze the difference in the expression of m6A regulators among different clinical stages of NAFLD. The results of significant difference analysis: *p < 0.05; **p < 0.01; and ***p < 0.001.

