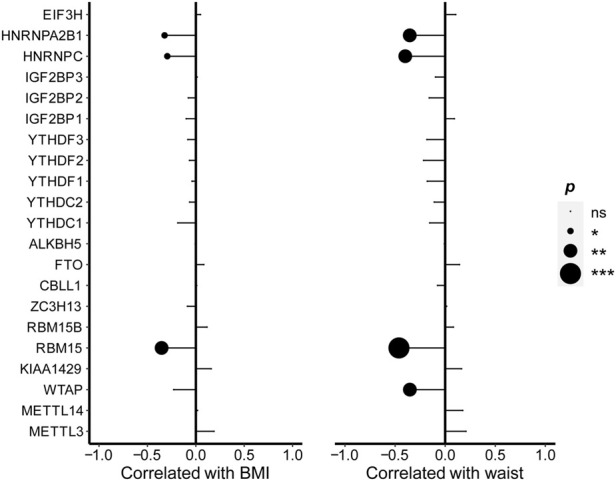
FIGURE 2.

Correlations between the expression of m6A regulators and BMI as well as waist. Pearson’s correlation was performed to calculate the correlation between the expression of m6A regulators and BMI as well as waist. The results of significant difference analysis: ns ≥ 0.05; *p < 0.05; **p < 0.01; and ***p < 0.001.
