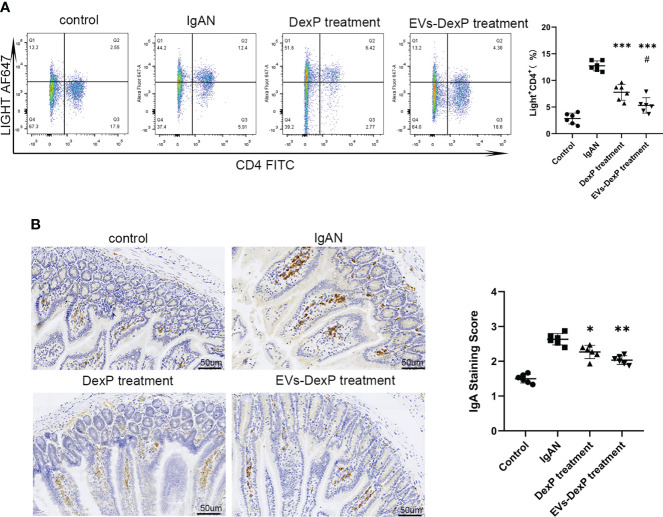
Figure 6.
Effect of EVs-DexP on intestinal IgA production. (A) Flow cytometry analysis of the ratio of LIGHT+CD4+ cells in PPs from different intervention groups of IgAN mice. (B) Immunohistochemical staining intensity of IgA in the intestine; scale bars, 50μm. Data are presented as mean ± SD of six independent mice per group. *p<0.05 vs. IgAN mice, **p<0.01 vs. IgAN mice,*** p<0.001 vs. IgAN mice; # p<0.05 vs. DexP treatment; one-way ANOVA.

