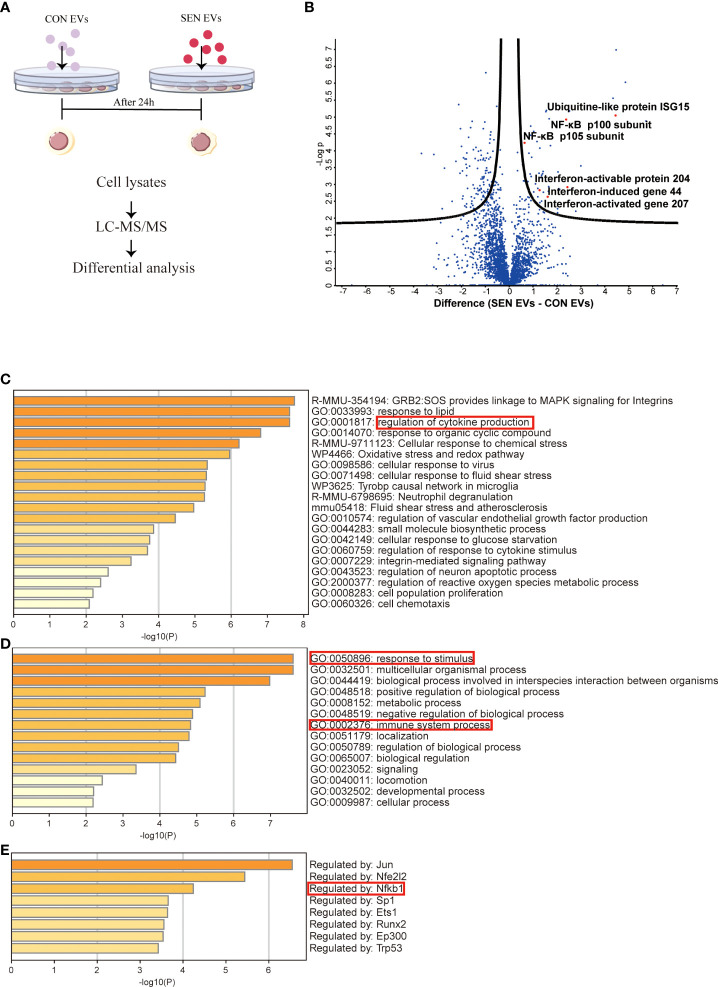
Figure 1.
Proteomics study of Raw 264.7 cells treated with CON and SEN EVs. (A) Workflow used for proteomic analysis. (B) Volcano plot of differentially expressed proteins; dots above the black curves represent proteins with differences with False Discovery Rate (FDR) < 0.025. Bar graphs of enriched terms (C) across input gene lists; (D) with GO terms only; and (E) by TRRUST. Data were from four independent repeats.

