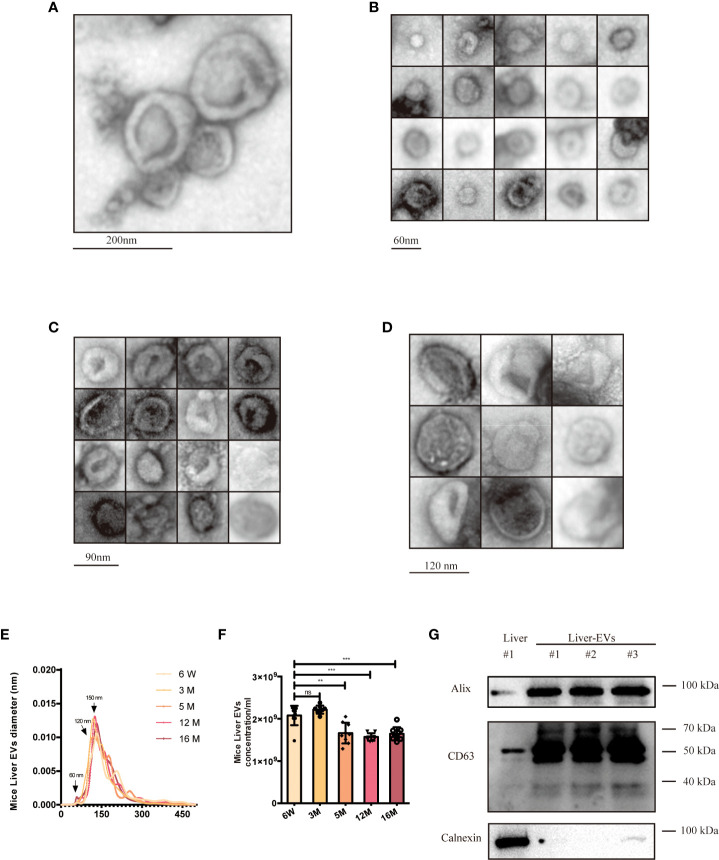
Figure 5.
Characterization of young (6-week old) and aged (16-month old) mice liver EVs. (A) TEM analysis of EV clusters; scale bars: 200 nm. (B) TEM analysis of small EVs (60 nm). scale bars: 60 nm. (C) TEM analysis of EVs with diameter of ~80-90 nm; scale bars: 90 nm. (D) TEM analysis of EVs at a diameter of ~120 nm. scale bars; 120 nm. NTA size distributions (E) and particle concentrations (F) of liver EV preparations from mice at six ages as indicated. (G) Western blot of Alix, CD63, and Calnexin from liver EVs and liver tissues. The data represent at least three independent experiments and are presented as mean ± SD. **p<0.01; and ***p<0.001; ns denotes not significant versus control..

