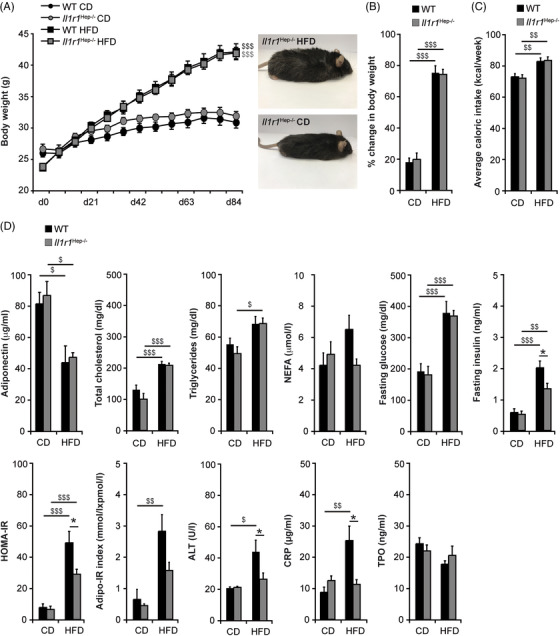
FIGURE 1.

Body weight gain and systemic metabolic alterations in Il1r1 Hep−/– and WT mice fed a high‐fat, high‐carbohydrate diet for 12 weeks. Eight to 10‐week‐old, male Il1r1 Hep−/– mice and WT littermates were metabolically challenged with a high‐fat, high‐carbohydrate diet (HFD) or received a corresponding control diet (CD) for 12 weeks. (A) Body weight curve, (B) % change in body weight, and (C) mean caloric intake during the entire experimental period. (D) Serum samples were drawn from fasted mice to measure the levels of adiponectin, total cholesterol, triglycerides, NEFA, glucose, insulin, ALT, CRP, and TPO after 12 weeks of dietary feeding and to determine HOMA‐IR and Adipo‐IR indices. Data in (A–C) represent mean of n = 7 Il1r1 Hep−/– CD, n = 10 WT CD, n = 15 Il1r1 Hep−/– HFD, and n = 15 WT HFD mice ± SEM. Data in (D) represent mean of n = 4 Il1r1 Hep−/– CD, n = 3 WT CD, n = 7 Il1r1 Hep−/– HFD and n = 6 WT HFD mice ± SEM (adiponectin), n = 6 Il1r1 Hep−/– CD, n = 8 WT CD, n = 11 Il1r1 Hep−/– HFD and n = 11 WT HFD mice ± SEM (total cholesterol, triglycerides), n = 5 Il1r1 Hep−/– CD, n = 5 WT CD, n = 6 Il1r1 Hep−/– HFD and n = 9 WT HFD mice ± SEM (NEFA, Adipo‐IR), n = 7 Il1r1 Hep−/– CD, n = 10 WT CD, n = 15 Il1r1 Hep−/– HFD and n = 15 WT HFD mice ± SEM (glucose, insulin, HOMA‐IR, and ALT), resp. n = 4 Il1r1 Hep−/– CD, n = 6 WT CD, n = 11 Il1r1 Hep−/– HFD and n = 9 WT HFD mice ± SEM (CRP, TPO). *p < .05 for Il1r1 Hep−/– versus WT and $ p < .05, $$ p < .01, $$$ p < .001 for CD versus HFD using two‐way method of ANOVA (A–D) and Kruskal‐Wallis H test (D [Insulin, HOMA‐IR, ALT, and TPO]) following the Bonferroni multiple comparison tests and Mann‐Whitney tests with a Bonferroni correction, respectively.
