FIGURE 2.

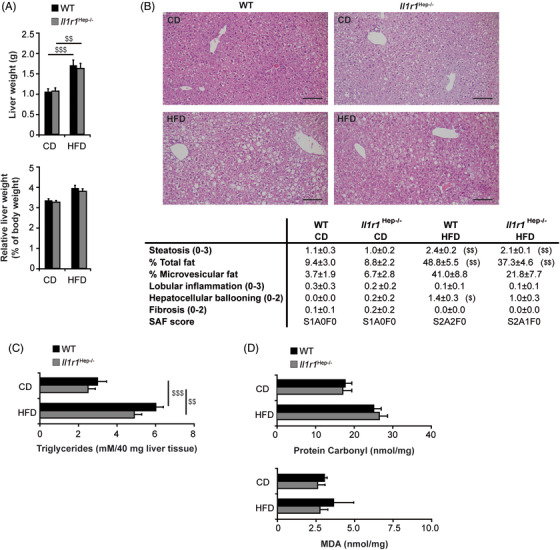
Effects of HFD feeding on the development of NAFL in Il1r1 Hep−/– and WT mice. (A) Absolute liver weight, liver‐to‐body‐weight ratio, (B) representative liver histology by H&E staining (scale bar: 100 μM) and SAF score, (C) biochemically determined liver triglyceride and (D) protein carbonyl and MDA content of Il1r1 Hep−/– and WT mice fed with the diets for 12 weeks. Data in A represent mean of n = 7 Il1r1 Hep−/– CD, n = 10 WT CD, n = 15 Il1r1 Hep−/– HFD and n = 15 WT HFD mice ± SEM, in B and C n = 6 Il1r1 Hep−/– CD, n = 8 WT CD, n = 11 Il1r1 Hep−/– HFD and n = 11 WT HFD mice ± SEM, and in D n = 4 Il1r1 Hep−/– CD, n = 4 WT CD, n = 8 Il1r1 Hep−/– HFD and n = 8 WT HFD mice ± SEM. $ p < .05, $$ p < .01, $$$ p < .001 for CD versus HFD using two‐way method of ANOVA (A and C) and Kruskal‐Wallis H test (B and D) following the Bonferroni multiple comparison tests and Mann Whitney tests with a Bonferroni correction, respectively. There was no statistical difference for Il1r1 Hep−/– versus WT with respect to these parameters
