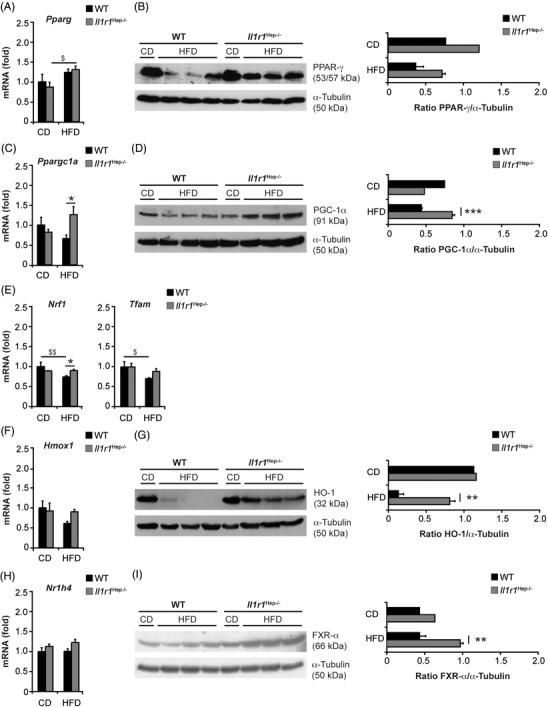
FIGURE 3.

HFD‐induced changes in hepatic lipid metabolism and mitochondrial function of Il1r1 Hep−/– and WT mice. Expression analysis of PPAR‐γ (A and B), PGC‐1α (C and D), NRF‐1, and TFAM (E), HO‐1 (F and G), and FXR‐α (H and I) in liver whole tissue lysates from Il1r1 Hep−/– and WT mice following 12‐week feeding of the HFD or the CD by qRT‐PCR (A, C, E, F, and H) and immunoblotting (B, D, G, and I). Data in A, C, E, F, and H represent mean of n = 4 Il1r1 Hep−/– CD, n = 4 WT CD, n = 7 Il1r1 Hep−/– HFD, and n = 7 WT HFD mice ± SEM. In B, D, G, and I representative immunoblots with densitometric analysis are shown. *p < .05, **p < .01, ***p < .001 for Il1r1 Hep−/– versus WT and $ p < .05 for CD versus HFD using two‐way method of ANOVA following the Bonferroni multiple comparison tests (A, C, E, F, and H) and unpaired, two‐tailed Student's t‐test (B, D, G, and I)
