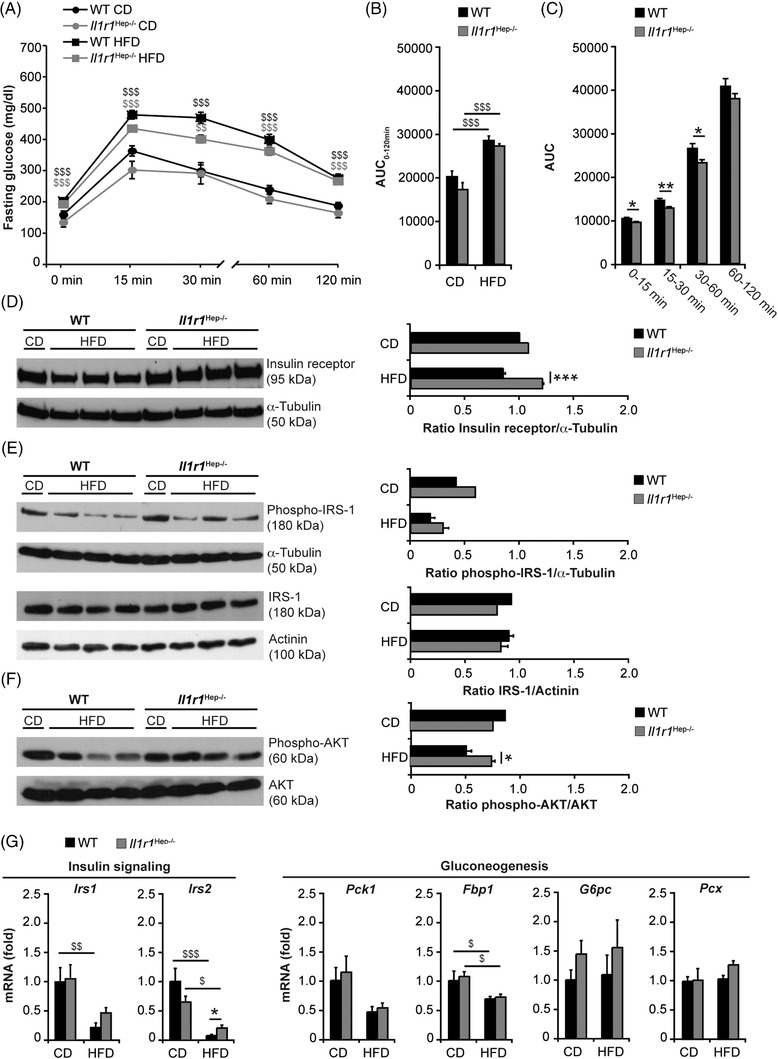
FIGURE 4.

Insulin signalling and glucose metabolism in HFD‐fed Il1r1 Hep−/– and WT mice after 12 weeks. (A) I.p. glucose tolerance testing in Il1r1 Hep−/– and WT mice following 11‐week feeding of the HFD or the CD, (B) the area under the curve (AUC, 0–120 min), calculated using the trapezoidal rule, in all experimental groups, and (C) AUC of first (0–15 min), second (15–30 min), third (30–60 min), and fourth phase (60–120 min) in HFD‐fed Il1r1 Hep−/– mice vs. WT littermates. Molecules involved in hepatic insulin signalling were assessed by immunoblotting of (D) insulin receptor, (E) phospho‐IRS‐1 (Ser307) and total IRS‐1, (F) phospho‐AKT (Ser473) and total AKT following insulin injection, and (G) qRT‐PCR analysis of genes encoding IRS‐1, IRS‐2, and the gluconeogenic enzymes PEPCK, FBP1, G6PC, and PC in liver whole tissue lysates prepared from mice fed with the HFD or the CD for 12 weeks. Data in A–C represent mean of n = 6 Il1r1 Hep−/– CD, n = 8 WT CD, n = 11 Il1r1 Hep−/– HFD, and n = 11 WT HFD mice ± SEM. In D–F representative immunoblots with densitometric analysis are shown. Data in G represent mean of n = 4 Il1r1 Hep−/– CD, n = 4 WT CD, n = 7 Il1r1 Hep−/– HFD and n = 7 WT HFD mice ± SEM. *p < .05, **p < .01, ***p < .001 for Il1r1 Hep−/– versus WT and $ p < 0.05, $$ p < 0.01, $$$ p < .001 for CD versus HFD using two‐way method of ANOVA following the Bonferroni multiple comparison tests (B and G) and unpaired, two‐tailed Student's t‐test (C–F)
