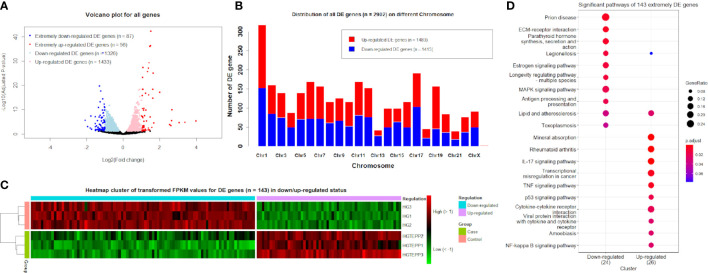
Figure 1.
Identified differentially expressed (DE) genes. (A) Volcano plots for all genes based on log2(FC) values and adjusted P-values. Genes with thresholds of adjusted P-value ≤0.05 are identified as DE genes, while genes with thresholds of adjusted P-value ≤0.05 and |log2(FC)| ≥1 are identified as extremely DE genes. (B) Distribution of DE genes (n = 2,902) on different chromosomes. (C) Heat map cluster for DE genes (n = 143) in downregulated and upregulated status. The colors from green to red indicate the gene expression levels from low to high after the transform of log10(FPKM + 1). HGTEPP1, HGTEPP2, and HGTEPP3 indicate the three replicate samples in the case groups that were treated with 10 μM TEPP-46 in 25 mM HG medium, while the rest of the three samples are in the control groups that were treated without TEPP-46 in 25 mM HG medium. (D) Significant pathways for extremely DE genes (n = 143) under the downregulated and upregulated categories.

